Quicklinks:
Open Source demonstration web maps (using Carto.com):
Lovell in Montreal City Directory 1880-81 base map
https://canadian-hgis.carto.com/builder/70212344-415a-11e7-9fef-0e3ff518bd15/embed
Final Map of Market Vendors Work and Home – With Widgets
https://canadian-hgis.carto.com/builder/a20b5b37-52ed-417b-b6fa-f73d618d6fcd/embed
ArcGIS Online demonstration web maps:
Lovell in Montréal 1880 Basic Web App: Original layers and ArcGIS Basemap
Montréal Market Vendors Work and Home ca 1880 Filtering App
http://hgisportal.esri.ca/portal/apps/MapAndAppGallery/index.html?appid=f081eb9a363c46caa37c77d132def423
For detailed pilot project development documents see links at end of this article.
Montréal, l’avenir du passé (MAP) has been a landmark project in Canadian historical GIS. Professors Sherry Olson, Robert Sweeny and their collaborators at McGill University recorded, mapped and analysed many of the data sets basic to understanding the context of urban history for Montréal in the 19th century: the urban fabric including building type from historical maps from 1825, 1846 and 1880; demographic data from a number of Censuses; information about local residents and businesses from City Directories. Their website, based at Memorial University, goes into details about these data and the various applications which have been made available for researchers and students to explore them. (http://www.mun.ca/mapm/)
However, as part of the open discussion at our Geohistory/Géohistoire project meeting in August of 2016, our collaborator Robert Sweeny expressed his disappointment (if I may paraphrase) at what might be called the failed promise of online mapping. Interactive mapping and GIS tools should not limit users to viewing pre-digested results of research, much as printed maps were able to do. These tools should allow active exploration of historical GIS-enabled data, including posing new or unanticipated questions, drawing out new or unanticipated spatial relationships – in short, allow the user to use GIS tools to explore and analyse data, in an online environment.
Many voices rose from the audience to assure Robert that online GIS applications and tools were under development at that time, and would soon enable the kinds of inquiry that he envisaged and expected. And truly, these tools have been emerging in the last year or two, both in the Open Source community and in the ArcGIS Online world. Robert may have been somewhat skeptical, but he remained ready to be convinced. And so when looking for pilot web mapping projects for our partnership in late 2016, we approached him with a question: would he come up with a scenario for proving the case that online GIS tools had come of age? That what students in his classroom had always needed full GIS software programs to achieve, could now be completed using a web browser?
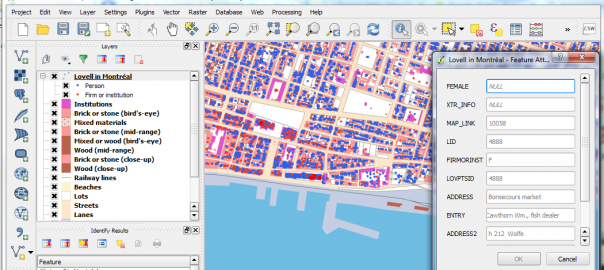
What Robert responded with was a “Scenario for markets based on MAP’s 1880 Lovells QGIS application,” which appears as Appendix 1 in the full-length development documents for which links appear below. To quote a relevant section:
“As is still the case in many parts of the world, people in 19th century Montreal bought most of their food at markets… From west to east St Gabriel, St Antoine, St Anne, St Laurent, St James and Papineau wards each had their own market, while Marché Bonsecours on St Paul Street served as the main market…. In the Lovell’s city directory it was frequent for people who leased stalls in the retail markets to also list their home address. These addresses are an indication of how local the ward markets were. In this exercise we will be comparing this residential information with other variables to assess the character of these differing markets.”
The “other variables” Robert’s scenario is most concerned with are Occupational. He outlined a method using QGIS for drawing connecting lines between the work locations for Market vendors, and their residential locations (as well as these could be determined.) He then suggested different occupation types might have different residential patterns relative to the market work locations. Or perhaps different markets would exhibit more local or more far-flung connections to vendors’ homes. Identifying these locations and drawing the connecting lines between them opens up a wealth of analytical possibilities.
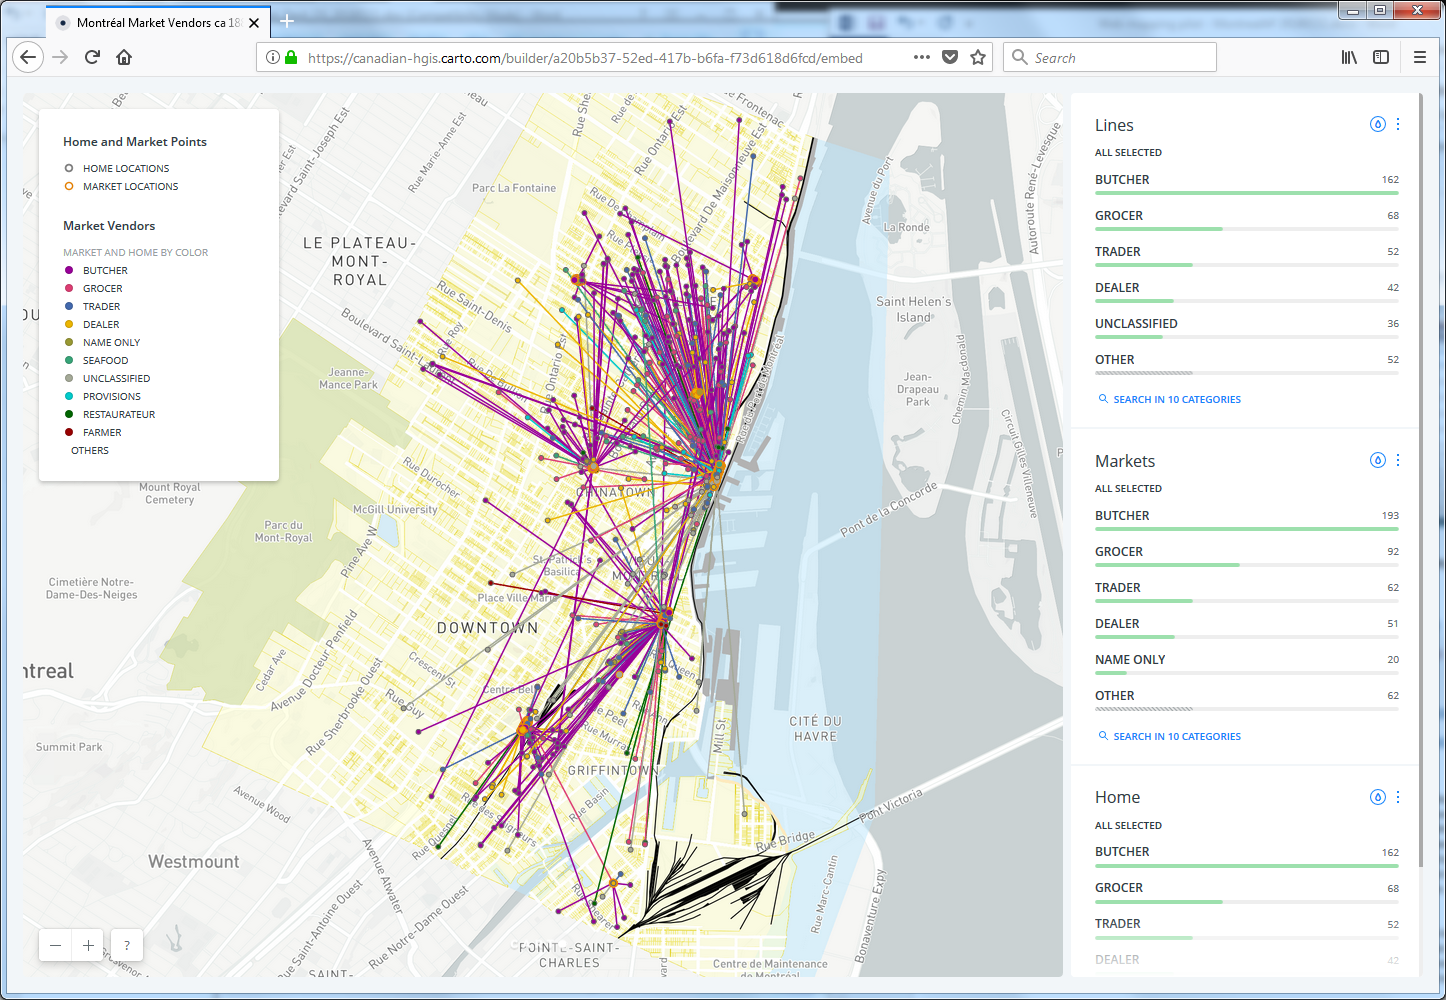
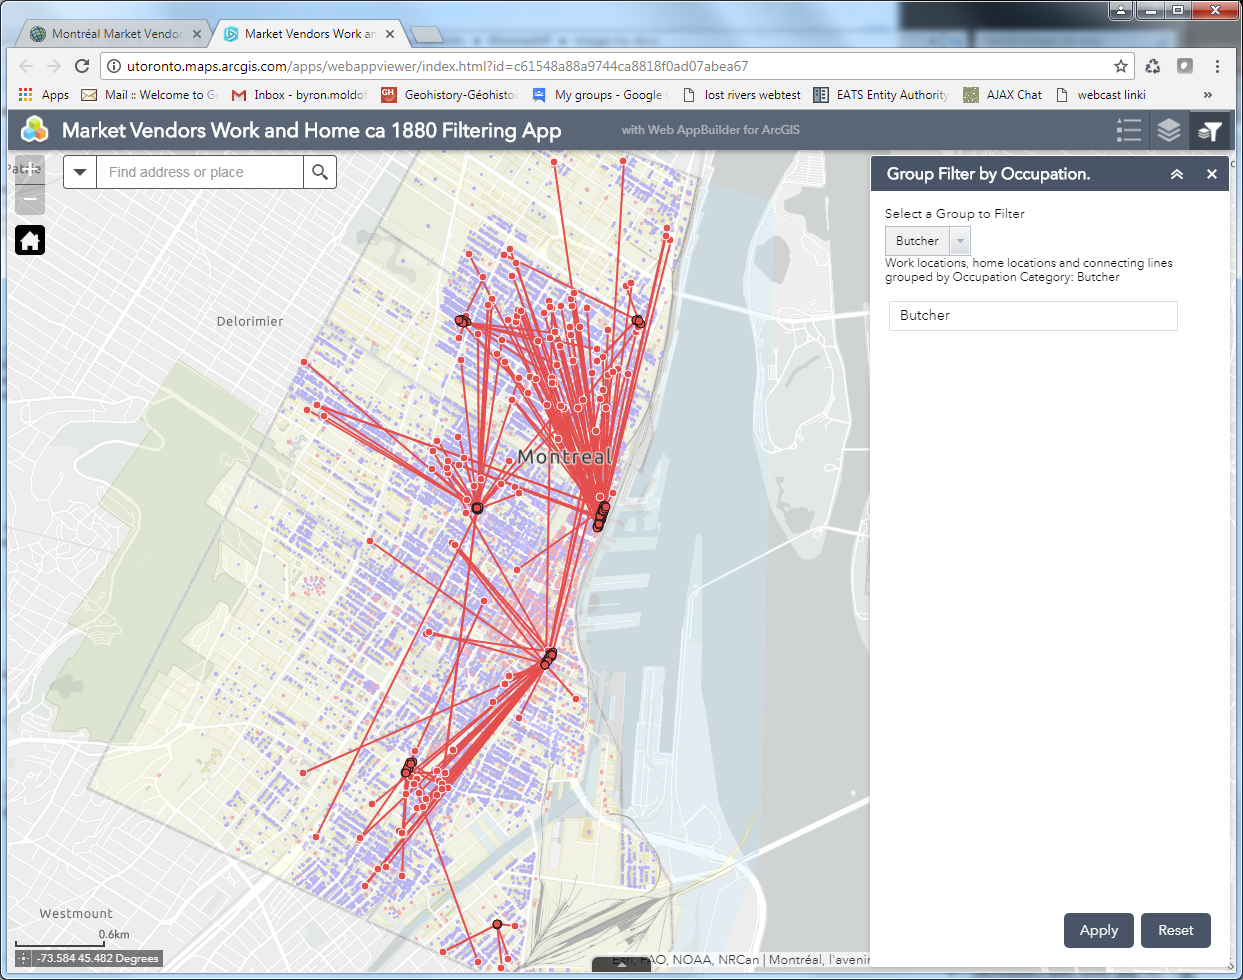
So this is what we attempted to do, first using the Open Source Carto tools, and then using ArcGIS Online. The resultant web maps illustration vendors’ work and home sites look remarkably similar (as one would hope!) Quick default views of these are pictured below: the Carto map showing all of the occupational categories, the ArcGIS Online map showing the symbols and lines just for “Butchers” in the markets.


A side note: Unlike our other pilot projects, which focus on functionality and customization of coding for map design and presentation, this project is primarily about enabling the user to analyse and explore data interactively. Therefore rather than a breakdown of the code required to produce a final web-map, our detailed documentation consists of the step by step process for using the latest online tools from Carto.com and ArcGIS Online (as of mid-2017) to achieve the objectives of the exercise.
There are similarities, and there are differences, in how the two toolsets approach the tasks at hand, and the final products are certainly distinct. More similarities than differences exist though – which often prompts an intriguing conversation many of in online mapping have had: who’s following whom? No space to explore that question here, but feel free to post your own comments below.
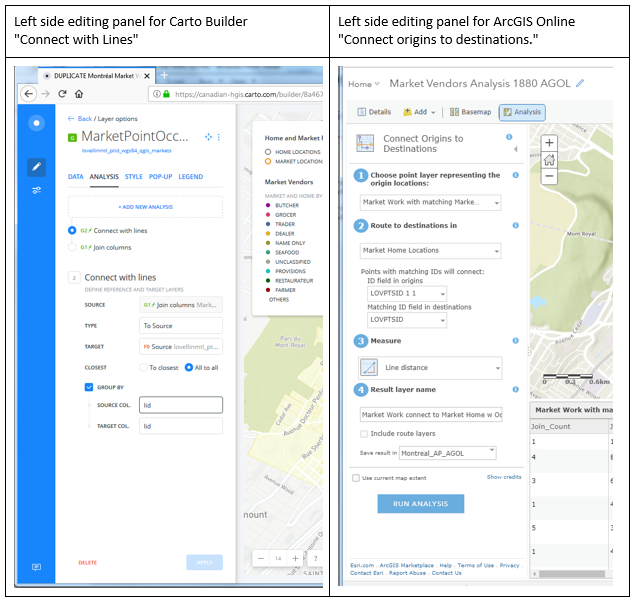
Some of the similarities are superficial. For instance, the tools to achieve these products are fairly recent additions to their online toolboxes. Both software suites number these among what they both call “Analysis” tools. Their menu-driven editing interfaces look similar, as pictured below. Carto uses an Carto Builder “Analysis” tool called “Connect with Lines”, to create connections between point locations. ArcGIS Online uses an “Analysis” tool named “Connect Origins and Destinations”, to achieve a similar outcome. However, the AGOL tool is actually built to do network analysis and routing, and has much more sophisticated potential applications, whereas the Carto tool is limited to making straight line connections between points.

Despite the relative limitations of the Carto tool, it does achieve the outcome required by this project – and the flip side of its simplicity is that it proved to be easier to use, and much more forgiving in terms of its data requirements than the AGOL tool. For example, the Lovell Montréal data set of work and home locations turned out to have many more work locations than homes – not all market workplaces had identifiable matching home locations. And some market workplaces had many more than one “home” location associated with them. The Carto tool sailed through these discrepancies, and drew lines between all the matching points without any issues. The AGOL tool on the other hand, popped up the following error messages, in turn:

So in order to make the AGOL Origin-Destination tool work for our purposes, some significant data manipulation had to be completed – this is all described in the detailed documentation for those who are interested.
This is NOT to say that obliviousness to data discrepancies is always a virtue – trouble-shooting the data issues for the AGOL tool provided a much better understanding of which work points were actually connecting to which home points. Rather, it is just to say that, as usual, one must make sure that for any analytical task, the right tool for the job is identified and used.
In my estimation, both AGOL and Carto now provide the interactive online tools to map the data, and to allow the analysis for at least this specific scenario, that Robert Sweeny had desired for his students and other users of the Montréal, l’avenir du passé project data. However the question remains: is this an effective environment for doing this kind of work? GIS and other software providers are putting more and more functionality into browser-based “software as a service”, delivered online. The advantages are clear: any browsing device can access these GIS tools, nothing has to be installed locally, resulting in much broader access for users. The disadvantages: limitations in processing tools, limitations in interface and symbol design, and limitations in number of views allowed without paying fees. The question of what is best for any set of students or other users, requires a balancing of these issues.
Please feel free to post comments discussing these pilot projects using the space below.
For more detailed information about the work done on these pilot project web maps, we have mounted our technical development documents on this site, linked below.
LINKS TO DOCUMENTATION
Montréal Market Vendors ca 1880 Open-Source Development Document
Montréal Market Vendors ca 1880 ArcGIS Online Development Document
This post is also available in: French
