Category Archives: CHGIS Partnership news

Beard top photo

Historic Welland Canals Mapping Project

Mapping the historic canals one lock at a time!

Guest post by Colleen Beard, Brock University Maps, Data & GIS Library

Inspired by the rich local map and photo collections of Welland Canal history, this project (HWCMP – also available via Geohist Portal) illustrates an HGIS approach to reconstructing the past that has since captivated a large local audience – simply because it tells amazing stories!

Recently I have realized that the success of an HGIS project should not be measured by the number of publications it generates, but how it educates and absorbs an audience on a greater scale. After a number of public presentations demonstrating the HWCMP web app with stories, this is what attendees had to say…

“It was a fascinating presentation that left me wanting more.”
(Brock Library staff)

“Colleen’s presentation was a blast. The room was packed and after talking for an hour, the woman beside me said, Colleen could speak for another hour. It was that interesting. Amazing job!!!”
(Posted to Friends of the Welland Canals FB page, Oct.26, 2017)

Although there are many approaches to historical GIS research, this one combines current mapping technologies with historical maps, air photos, and images, to reconstruct the three historic canals as they would appear on today’s landscape. While there are many books, maps, and websites that document the historic canals, there is little that represents the historic mapping of the canals with the detail it deserves. Many technologies from the suite of ArcGIS products available through the Esri educational site license were utilized: ArcMap Desktop, Collector for ArcGIS, ArcGIS Pro, ArcGIS online (AGOL), Web AppBuilder for ArcGIS, and Esri Story Maps.
Beard Overlaymap

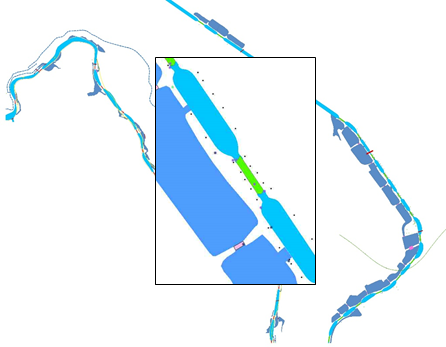
First built in 1829, the Welland Canal routed ships to circumvent Niagara Falls – a height of 100 metres (325 feet) – between Lake Ontario and Lake Erie. No other canal in the world has overcome a slope as steep as the Niagara Escarpment to transport ships. Yet its history is known by few. Using HGIS processes, the three 19th century canals in St. Catharines and Thorold, Ontario – the First (1829); Second (1845), and Third (1887-1932) – were digitally recreated to overlay on the current landscape. (The current, and fourth, Welland Ship Canal is well documented and is not yet history!) Although most historic features have been bulldozed or left for ruin, many of the Second and Third canal features have survived in one way or another (if you know where to find them).

Building on the Welland Canals Google Earth project of several years ago, routes of the canals and its locks are no longer simple lines and points on a map. Extensive heads-up on-screen digitizing using ArcMap processes has resulted in an accurate representation of the historic canals – including every route, lock, bollard, weir, weirpond, bridge, tunnel, pier, and raceway! The geodatabase is unique with detail never before created. It offers a solid foundation for which to build other geodatabases, such as period industry activity, historical road networks, vegetation and other landscape changes. The data was recently used by an archaeology student, David Connelly, to create a proposal for re-purposing the historic locks and environs using 3D models: Re-Engaging the Welland Canals.

Building the HWCMP
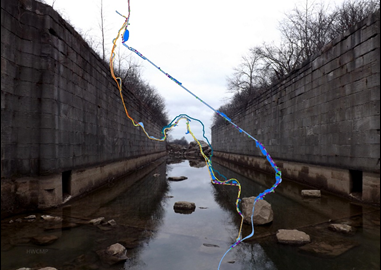
One of the goals of the project was to inventory all visible remains of the three canals, and to assess their structural integrity and ease of access. Of course, this required extensive field reconnaissance. Linked here is a map illustrating the hiking activity, either by foot, bicycle, or boat, covering approximately 80 kilometres. Collector for ArcGIS was used on an iPhone 6 Plus to inventory and capture the locations of all canal features. Photos and videos were attached that would later provide evidence to accurately assess their structural condition. The importance of geodatabase design that is used with Collector cannot be understated, and proved to be very convenient for documenting the canal features inventory. Determining classifications allowed features to be categorized at the time they were located in the field. These are illustrated in the web app Legend as the Features Inventory:
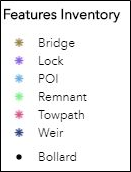
Beard Features legend An optional field was included in the geodatabase to enter brief text descriptions. However, when hiking in sub-zero temperatures this didn’t amount to much. Many of these descriptions were added later in AGOL and are included in the pop-up box with each feature. The photo and video attachments were critical in this assessment. Later, these would be deposited in the Brock Digital Repository for historical record, but more importantly to provide a sustainable url for including hyperlinks in the AGOL project.

Some preliminary mapping of the historic routes and locks also proved to be useful while hiking. This data was included as part of the map used with Collector. When in the field, I was able to determine an approaching canal lock or feature on my phone that was not clearly visible on site. If remnants were found, its location captured in Collector was a ground-truthing point that could later be used to accurately map the feature. This was particularly useful for locks and weirs where stone and concrete rubble were evident but the structure was deteriorating. High accuracy GPS or GPS averaging was not used. The resolution of Collector was at best within 3-5 metres, and to achieve this took patience while the iPhone reconfigured to the zoomed location. But it was good enough for the purpose intended!

As the vector data was created in ArcMap, feature classes were designed for the following:
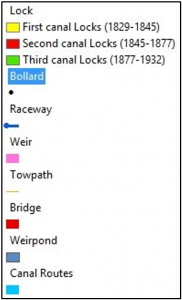
Beard Locks legend Attributes for the Lock and Weir feature classes included: visibility, condition; accessibility, and extensive description with photos – all included in the custom pop-up when a feature is “clicked” (selected) within the map view. The web app allows the user to interact with the historic routes of the canals, select its features and view modern photos of its current condition. Historical photos are also planted in the feature class tables and in some of the feature inventory pop-ups (the Collector points) that provides a “then and now” comparison of canal landscapes. Some are very startling, such as the Canal Valley through downtown St. Catharines (below) where the tranquil meander of the First and Second Canal waters have been replaced with parking lots, arenas, and a major highway. It’s a shame! But a reminder of why we engage in HGIS research in the first place.

Beard Scene side by side

The HWCMP digital vector data is currently available as open data in AGOL. It is anticipated that the data will also be accessible in several portals, including Brock’s Digital Repository, Scholars GeoPortal, and Niagara Open Data portal. One of the struggles is establishing an appropriate repository for data preservation, which continues to be investigated.

About the amazing stories!
To date, the project has been presented to the Historical Society of St. Catharines, The Brock Library staff, and has upcoming dates for the St. Catharines Public Library, Brock Geography Masters speaker series, the St. Catharines professional business retirees, and Carto 2018. An audience yet to capitalize on is the elementary/secondary school students!

The HWCMP talk is popular in the community because of the stories it tells. One is the story of the attempted terrorist attack to blow up Lock 24 of the third canal in 1900 – where the grandson of the convicted made contact with me, due to the web exposure of the HWCMP.

Others are the stories about mapping the canal features, uncovering remnants of old buried tunnels and providing image comparisons that take one back in time. Photo comparisons provide a remarkable “wow” factor to visualize landscape change. If there’s a compelling story to tell, it will seize the audience.

Colleen Beard, Brock University
cbeard@brocku.ca
OCUL site banner edited crop2

OCUL releases over 1000 early topo maps of Ontario…

Guest post by Amber Leahey, Scholars Portal, and Jay Brodeur, McMaster University Library

The Ontario Council of University Libraries (OCUL1) is pleased to announce the release of a shared digital collection of more than 1000 early topographic maps of Ontario, now available online!

Map libraries are really wonderful places–just ask any Librarian or staff member who provides patrons with services, guidance, and access to maps and associated cartographic material at university libraries across Ontario. Or better yet, ask the countless patrons who use the collections’ vast and varied information to support activities in their research, education, work, and private lives. Indeed, there is much to be said about sparking interest in maps and GIS by telling a story with old maps–which there are many of–at libraries across the province. With such rich and diverse map collections, and thanks to the careful curation and digitization of over 1000 early topographic maps of Ontario, academic libraries continue to play a key role in preserving our national and provincial heritage in the digital age.

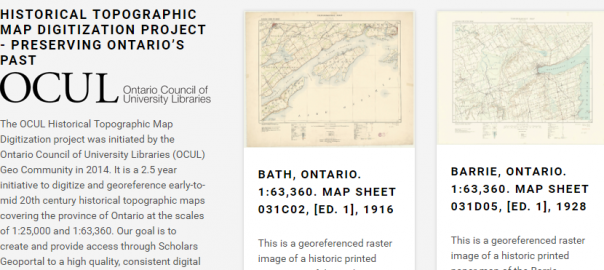
Led by the OCUL Geo Community, the OCUL Historical Topographic Map Digitization Project is a province-wide collaboration to inventory, digitize, georeference, and provide broad access to early topographic maps of Ontario. The initiative represents the single most comprehensive digitization project of the early National Topographic Series (NTS) map collection in Canada. The publicly-available collection provides access to georeferenced topographic maps at the 1:25000 and 1:63360 (one inch to one mile) scales, covering towns, cities, and rural areas in Ontario over the period of 1906 to 1977. As the collective achievement of individuals representing university libraries across Ontario, this shared collection exemplifies OCUL’s continuing commitment to collaborative approaches that improve access to knowledge both within and beyond the province. The completion of this project also serves as an opportunity to reflect on the history of the OCUL Geo Community, and celebrate the shared vision and effort that have made possible the current achievement.

The significance of historical maps

Much like a photograph, landscape painting, or textual account, a historical or otherwise superseded map preserves information from the past and provides its viewer an opportunity to explore the ways in which environments, cultures, and human knowledge have changed over time. As a part of their mission, map collections, libraries, and archives have a long tradition of preserving and providing access to a wide array of cartographic and cultural information.

In the present day, early topographic maps are a critical resource for those with an interest in historical events and exploring change over time. For many researchers, local historians, planners, conservationists, engineers, and consulting firms (to name but a few), historical topographic maps provide a unique snapshot of a given time period, showing both man-made and natural features such as spot heights, waterways, shorelines, boundaries, roads, railways, houses, barns, electricity lines, industry, agriculture, and much more.

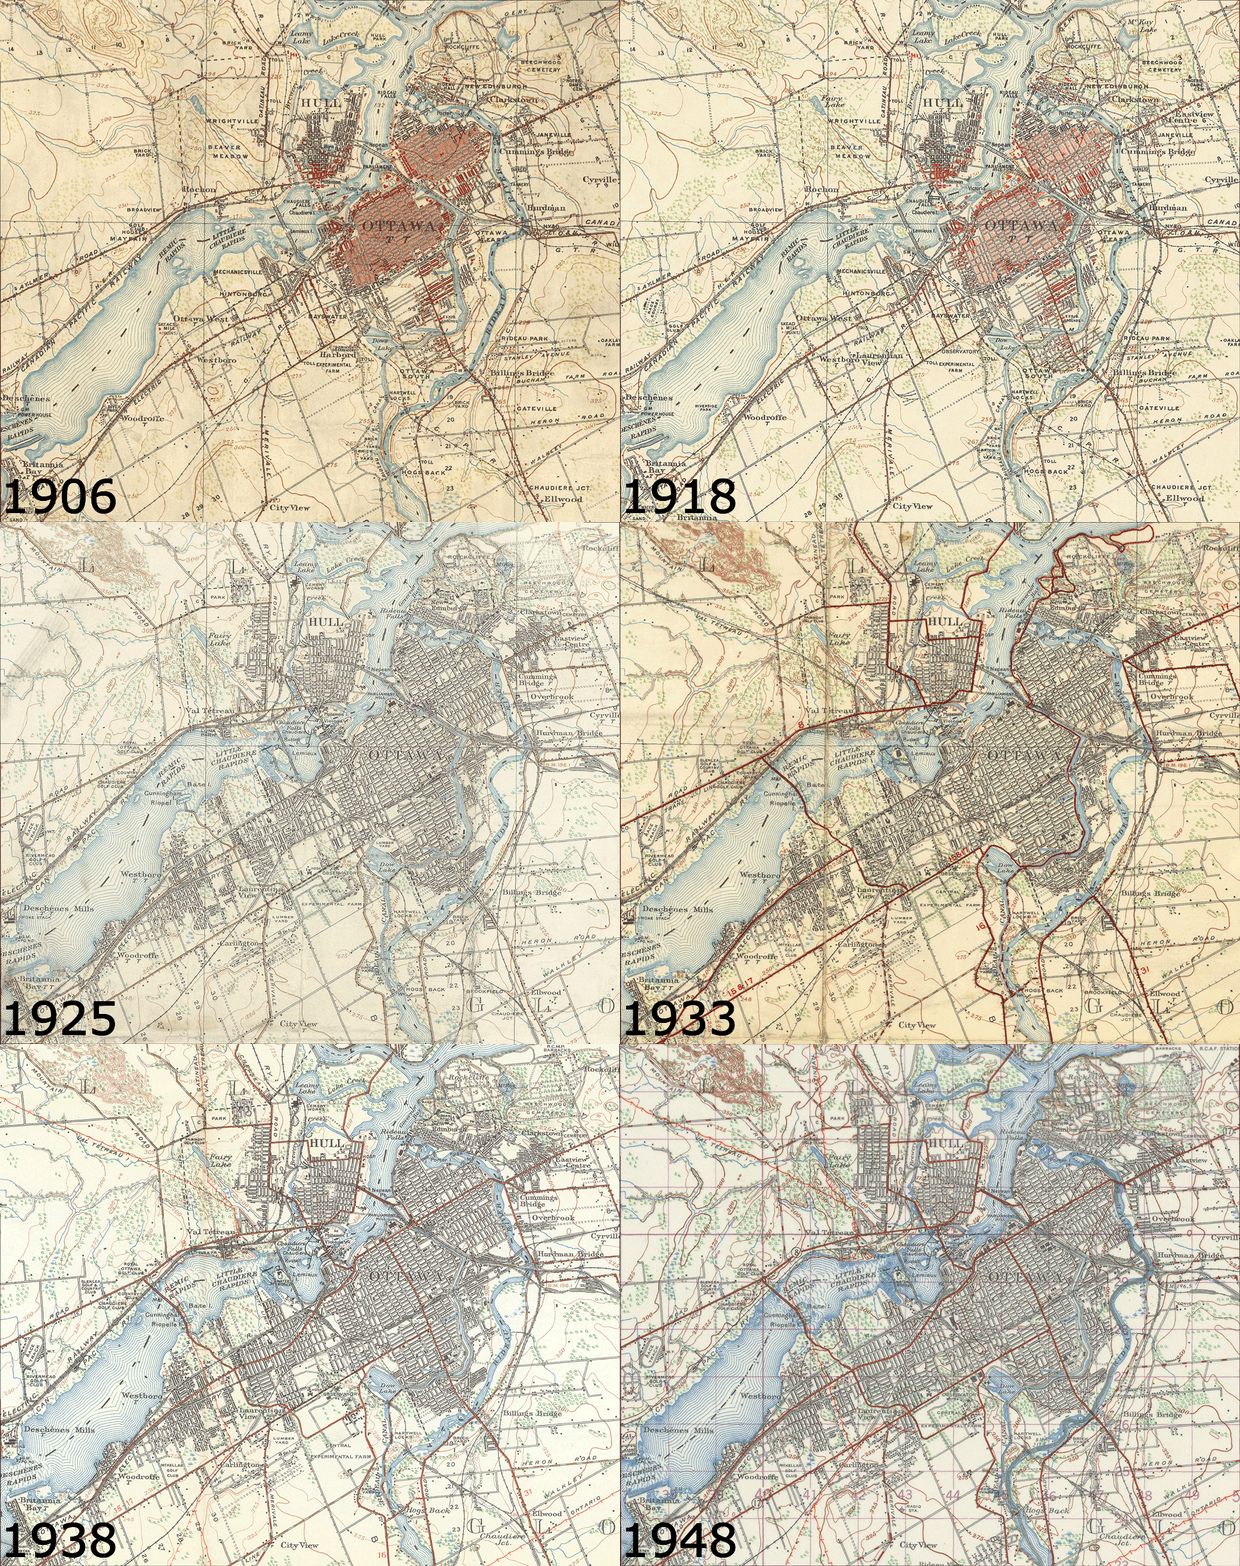
Ottawa’s Changing Landscape and Growth 1906-1948
Animated compilation of early topographic maps of the Ottawa area, showing changes and growth between 1906 and 1948.
From curation to digitization: The role of the OCUL Geo Community

Among the challenges faced in producing such a comprehensive digital collection is the effort required to inventory and bring together sheets that exist across a multitude of map libraries. Given the variety and quantity of maps that are created during any given period and the finite nature of storage space and budgets, map collection curators are required to make careful (and often difficult!) choices about the collections they develop, steward, and preserve over time. As a result, many institutions have focused their topographic map collections around items of local relevance and significance. In Ontario, for example, the maps that make up the digitized series–originally produced by the Department of National Defence (until 1923: the Department of Militia and Defence)–are dispersed across many Ontario University Libraries. Over the years, Ontario libraries have collaborated to develop a comprehensive inventory of known maps from the series in existence, working closely with the Ontario Archives and Library and Archives Canada more recently for this digitization project. That the vast majority of sheets in these collections could be found at OCUL institutions is a testament to the foundational work of the early Geo and Map Communities.

As the predecessor of the OCUL Geo Community, the OCUL Map Group (then known as the OULC Map Group) was formed in 1973 with the goal of communicating and collaborating on map-related projects. Among their completed initiatives was the creation of a union catalogue of topographic maps across institutions. The importance of this work to OCUL Geo’s current-day success shouldn’t be overlooked, as these foundational efforts provided a means for coordinating map collections across OCUL institutions, and helped ensure maximal collective coverage in a cost- and space-efficient manner. Today, the OCUL Geo Community continues the goals of its predecessor, with a commitment to fostering dialogue around important issues such as best practices for the digitization of maps in libraries, access to maps and GIS for research, and collaboration on a variety of library activities in these areas.

Moving forward, the group plans to engage with the wider map community in Canada about the project, specifically at the upcoming Association of Canadian Map Libraries and Archives Carto 2017 Conference being held in Vancouver, B.C. in June (ACMLA website). The group hopes to identify opportunities to build on the project, engaging with other university libraries and archives, to digitize maps from this national collection.

We are very excited about this release, please let us know how you may be using the maps for your next project! For more information or to get in touch with us contact the project members at topomaps@scholarsportal.info.

We hope to hear from you!

1 OCUL is a consortium of 21 University Libraries in Ontario, and fosters collaboration around library activities and services including map and GIS collections, digitization, and digital curation.  Ontario’s university libraries have been working together through OCUL on initiatives such as this since 1967. In 2017, OCUL is celebrating its 50th anniversary, and this project demonstrates the ongoing success of this collaboration.}

Moldofsky_Sec2M1_freq_for_post_rescale

Update on Historical GIS web-mapping pilot site

Last June at our mid-term conference we presented preliminary results from our research on Geovisualization methods for Historical GIS in Canada. That presentation along with a number of the others presented that day are available on this website, via the program document with embedded links AVAILABLE HERE (Scroll down to Whitepaper update: HGIS Geovisualization (Byron Moldofsky)).  Since that time we have been working on revisions to the paper reviewing that research – and we also decided to change the titling of it from “White paper” to “Working paper” – reflecting the exploratory character of some of the research and the speculative nature of its results. The full “Working paper” is now available AT THIS LINK.

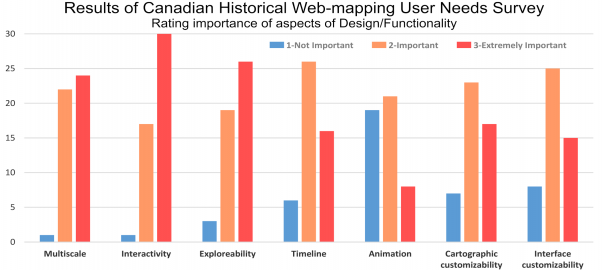
The paper may appear discouragingly long, but please do not be put off – about two thirds of the text is a reproduction of the online questionnaire we administered (Appendix 3: Canadian Historical Web-mapping User Needs Survey) and detailed reporting of some of the results of that survey (Part 4. Results of Canadian Historical Web-mapping User Needs Survey.) Many of you went online to take this survey – so you may be interested in what your peers have had to say, in the aggregate (see chart above, for example), and in selected comments. Thank you again for sharing your experiences and thoughts.

These “Results…” are the main addition to what was presented last June, along with a more developed “Part 5: Next steps: Developing principles of practice and for Canadian HGIS web-mapping activities, and plan to implement these in our Partnership development pilot website.” (pp. 45-48.) In this section we make the following proposals for principles of practice in developing our project’s collaborative web-mapping resources, which I would like to highlight here:

(Proposed) Principles of practice for Canadian HGIS Partnership web-mapping activities

  1. Support long-term sustainability and sharing of data and mapping
  2. Support of visualization for both presentation purposes and data exploration and analysis
  3. Support transparency of the web-mapping process, through good meta-data and documentation
  4. Support of multiple platforms, both technical (OS, browsers) and mapping (including proprietary and FOSS4G technologies)
  5. Working collaboratively to avoid duplication of effort and competition among current collaborators and potential partners

These principles are my interpretation of the responses to the User Needs Survey, and the discussion among the project members at meetings including the mid-term meeting last June. I would very much like to gather reaction from potential users and collaborators – so you are invited to respond by email or in the Comments section below this post.

Principles, however, are not of much use without a plan to implement them. The working paper proposes a three-pronged approach to supporting project HGIS web-mapping goals:

(Proposed) CHGIS Partnership development web-mapping pilot website activities

  1. Analytical evaluation framework: A set of questions to consider and evaluate in deciding on historical webmapping approach and technology
  2. Historical web-mapping technology profiles: Standardized descriptive comparison of technologies, incorporating “reviews”
  3. Comparative examples of web-mapping approaches: Examples of historical web-mapping projects using the same data and citing the same goals but using contrasting technologies

These three approaches are laid out in some detail in the concluding section of the working paper (Part 5, pp. 45-48), with tangible results proposed for each. If you have time, please take a look at this final section which outlines these pilot project activities, and suggests sample data sets, and let me know if you have any concerns or suggestions, either in the Comments section below, on the email listserv discussion thread or by personal email.

As we all know, such activities can consume large amounts of time and resources. We have reached consensus that the priority on the web-mapping side should be 3. Comparative examples of web-mapping approaches, while not completely neglecting the other two activities. Over the remaining months of the project we will work to create sample projects online for several of the data sets suggested within the paper. We have already started on these, and enlisted some of our partners and collaborators for data and technical assistance. We will try to provide one or two progress reports via these News and Notes posts, as soon as we have some neat web-mapping to show you!

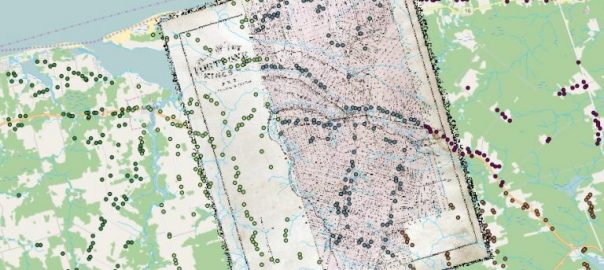
Detail of a georeferenced historical map and the combined digitized house locations from the 1880 Historical Atlas of PEI. Each student digitized a different township, symbolized here by the different colours.

Teaching Historical GIS and Restoring Lost Communities in the Classroom

This article is a cross-post from The Otter ~ la loutre, and is part of a series on using historical Geographic Information Systems (GIS) for teaching and research in environmental history and historical geography. It is part of a collaboration between the Network in Canadian History and Environment (NiCHE) and the Canadian Historical GIS Partnership Development project. Other articles in the series are available here. If you would like to contribute a post to the series please contact the editors Josh MacFadyen or Jennifer Bonnell.

Canadians have been hitting above their weight in the area of geospatial analysis since the development of the Canada Land Inventory and the world’s first Geographic Information System (GIS) in the 1960s and 1970s. Similarly, environmental historians and historical geographers have made great gains in Historical Geographic Information Systems (HGIS) research over the last decade, including several NiCHE projects, a 2014 edited collection, and now the Canadian HGIS Partnership. Canada is big. And in typical high modernist fashion, postwar scientists trying to fathom it ignored the knowledge of the rural, northern, and indigenous people who understood its land and water. Instead scientists turned to digital tools like GIS to examine and measure the nation. In what we believe is a post-normal and integrative approach, environmental historians are now both using the software and critiquing the normative processes it helped to create. But Canada is still big; its libraries, students, and other knowledge resources are very far afield. Our communities of digital scholars employ digital tools to collaborate and communicate our results across the continent. This post focuses on the students using these tools and the new ways historians are teaching HGIS online. This kicks off a series written by NiCHE and CHGIS collaborators on geospatial tools and analysis for Canadian historians.

Click here to go to complete article on Niche site…

Highlights of mid-term conference June 20, 2016

On June 20 we hosted the project’s mid-term Conference, at about the half-way point of our 2-year mandate. Interested folks from around the country were invited to attend in person at the University of Toronto, or tune in online to our video webcast. The conference program, with embedded links to many of the speakers’ presentations, can be found here.

Project collaborators reported on progress made to date on the planned white papers, and on how we have been advancing the project’s goals. More about the white papers will be posted in the future, as completed versions are released or excerpts published. Several of the related slide presentations are online, however, again linked through the conference program. Feedback to the authors via email is invited.

We also invited speakers from other related GIS and webmapping initiatives to bring their own unique perspectives to the group. For those of you who could not be there, here are a few of the highlights:

Amber Leahey (Scholar’s Geoportal): Amber gave us some of the background on the Scholar’s Geoportal, a GIS data portal/discovery engine run by the Ontario Consortium of University Libraries, and housed at the University of Toronto Library. Their experience with storing and linking to large GIS data sets, and the process of improving the discovery, extraction and data preview aspects of this site can provide our project with significant help in organizing and designing our own pilot Historical GIS data portal over the coming year.  Amber’s presentation slides may be viewed at this link.

Iain Greensmith and Jonathan Van Dusen (Esri Canada): Esri has been an enthusiastic partner and collaborator in this project, and Iain outlined some of the capabilities of their GIS data portal “sandbox” installation that has been set up for experimentation by collaborators. He once again asserted the capabilities of Esri’s portal options to link to data stored remotely, as well as in Esri Online, and make these available to those with or without an Esri license, under certain configurations. He highlighted the customizability of the portal’s front end, and touched on the geovisualization possibilities of their software. These were explored in more detail in an afternoon session by Jonathan, who reviewed Arcgis Online and Story Maps strengths and options for customized web-mapping. Iain’s presentation slides are linked here; Jonathan’s slides are found at this link.

Caitlin Blundell (Geoalliance Canada): Caitlin is the director of communications at GeoAlliance Canada. GeoAlliance is built on the foundation of the Canadian Geomatics Community Round Table, and its mandate is to raise the profile and efficacy of the Geomatics sector in Canada in 3 main areas: Sector Identity, Education and Data Access. When asked in the Question Period how Historical GIS could fit into their framework, Caitlin responded with her own question: “Do you think the Historical GIS community would benefit from a national population that had a greater awareness of the value of GIS and  geomatics and geography in general?” (audience murmured general agreement…) “If you walked into a historical conference and said ‘I do historical GIS’, and people said oh I know what that is, GIS is neat and really helpful…’ Does that happen now?” GeoAlliance has a “rising tide lifts all boats” type of approach, and are welcoming to all GIS sectors, but we will have to figure out how to work with them to everyone’s advantage. Caitlin’s slide presentation is found at this link.

In the afternoon we enjoyed a number of presentations related to HGIS research and teaching. Robert Sweeny outlined his White Paper giving an historical perspective on the evolution of HGIS in Canada, with particular reference to urban HGIS projects like “Montréal l’Avenir du Passé”. Geoffrey Cunfer then outlined what he characterized as “an alternative history of Historical GIS in Canada… another path through environmental history…”, more focused on rural environmental HGIS projects. Interesting contrasts indeed! Following that, Marc St.-Hilaire, Josh MacFadyen, and Don Lafreniere with Dan Trepal spoke about their research and teaching experiences over the last few years. Again, several of these are accessible as slide presentations (and Robert’s as a paper, to which he invites comments) linked through the conference program.

Subsequently the session on Historical Geovisualization featured a couple of guest speakers, as well as some drama.

We had scheduled Jonathan Marino, from Mapstory.org as a key speaker in this session, since Mapstory.org is a fascinating example of a geovisualization “storytelling” project that appeared well funded and utilized open source mapping tools, and had gained a lot of traction in the U.S. a year ago. In spite of this, the project decided to do a complete re-design of their user interface. This caused an interruption in service of almost a year, and they are just getting re-launched now. If that wasn’t dramatic enough, Jonathan emailed us the day before our conference, and explained that he had just returned from Africa the previous day, and appeared to have a virulent strain of the flu – or perhaps malaria. In any case, he was in no shape to travel. We were very disappointed, and wondered if he might be open to presenting remotely. With some help from the U of T Media Tech staff, in the few minutes before his time slot, we managed to get him online with slides and sound working fine – and so he presented from Washington, D.C. Despite a hacking cough, Jonathan gave us an interesting outline sketch of Mapstory’s genesis as “The atlas of change that everyone can edit”, a place to communally store and share geographical data, and build narratives. It appears that the main reason for their re-boot was the need for more sophisticated group editing tools – the need for Wikipedia-style capability to track changes and curate the data in “consensus” data layers. Jonathan was able to go into some of the details behind this transformation, technical and political, and answer some of our questions. Jonathan’s slide presentation can be accessed here.

A different approach to geovisualization online, also unique, is the Neptis Geoweb. (www.neptisgeoweb.org/) The Neptis Foundation (www.neptis.org) is one of our project partners, and Marcy Burchfield, the executive director, reviewed the evolution of this webmapping platform, which was designed to examine urban growth at the regional scale, primarily working in the Greater Toronto Region to day. A sophisticated interface, the Neptis Geoweb does offer customized depictions of regional planning issues (including historical urban development) but is also interested in the integration of VGI or “volunteered geographic information”. They have tried to do this by allowing people to create their own “User stories” – but, similarly to Mapstory, it is here they have run into some challenges. We hope to utilize the experience of Neptis personnel in working through our project’s design of our pilot webmapping site.

The day concluded with reactions from some participants, and then a discussion of “Where we go from here?”. A wide-ranging conversation about the strengths and weaknesses of HGIS in Canada seemed to crystallize a few important principles for the project:

  • Making HGIS data available, including national historical base data, should be the priority for the project, to be as open-access as possible, to the academic and non-academic community
  • The data does not need to be in a central repository, but metadata and discoverability need to be robust and prioritized in the portal design
  • We need institutional partners to support these efforts, rather than ephemeral grant-based support, and libraries and others with the mandate to preserve data are natural allies

These ideas were followed-up in the project business meeting the next day, and the collaborators as a group are determined to make sure we take these ideas through to a successful conclusion. We will keep you all informed and continue to get your input as we pursue these goals over the next year!

Preview of mid-term conference June 20, 2016

The Canadian Historical GIS Partnership Development mid-term conference coming up this June 20 looks like it will be a landmark day. We have invited a number of folks – some collaborators and some from outside our group – to talk about their own projects, and how these relate to historical GIS data and mapping in Canada. Just as a few examples – Marcy Burchfield from the Neptis foundation (neptis.org) is coming to speak about how their research into urban growth and planning in cities across Canada benefits from incorporating historical land use and development data, and their experience with engaging the public with online mapping. Geoffrey Cunfer is the director of the University of Saskatchewan Historical GIS Laboratory (www.hgis.usask.ca) and will give us some insight into how this successful facility contributes to environmental historical research on the North American plains, as well many other historical GIS-based international studies. Caitlin Blundell is Communications Director for GeoAlliance Canada (geoalliance.ca) and will share what happened at their “Map to the Future” meeting in Calgary last March and discuss how GeoAlliance Canada will support the geomatics and geospatial community in the coming years. What is the place for historical GIS in this broader geo community initiative? And Jonathan Marino is coming from Mapstory.org, to talk about how their project has created “The atlas of change that everyone can edit” – and some of the achievements and challenges along that path.

We also expect to have participants, in-house or online, from Statistics Canada, SSHRC, libraries and universities across the country, and (we hope) lots of non-professional history buffs. If you can make it to Toronto, please register and join us in person at the corner of St. George and Bloor (see Conference Program for the address.) And if not, please join us online – login details to come later.

Byron Moldofsky
Project Manager
Canadian Historical GIS Partnership Development Project

Signal Boost: The Value of Cross-Sector Partnerships

Over the past several decades, organizations across Canada have worked independently to promote geospatial literacy and the value of geospatial data, tools and technologies. They’ve targeted different audiences (including school children, decision makers in government and industry, the general public, and academe), with varying degrees of success. Many have reported that the impact of these communications was limited by a lack of popular awareness of the value of geo. Wouldn’t it be easier to communicate the value of historical GIS if you were confident your target audience actually knew what GIS was to begin with?

GeoAlliance Canada is working to unite the diverse groups and organizations that make up the Canadian geo community under one umbrella, to work together to create an easily understood, consistent message communicating the economic, environmental and social value of geo. By pooling our energy and resources to create a consistent baseline message, each of our independent signals can be louder and achieve more.

Many of the challenges facing the CHGIS partnership echo the discussions we’ve been hearing across the country. Communicating the value of geo to citizens, fostering collaboration across sectors and disciplines, avoiding unnecessary duplication of efforts and ensuring that all users can access high quality data are commonly recurring themes within our national community.

In the face of these challenges, the CHGIS partnership has seen great success in building partnerships and working across organizations and silos. So what can GeoAlliance Canada do to support the second half of your project? How could you benefit from access to a cross-disciplinary national network? How can we boost your signal to help you achieve your goals? And, if historical GIS should be a part of our national sector identity, what are the key messages you wish to deliver to your peers and colleagues in the community?

GeoAlliance Canada is a neutral platform for the Canadian geomatics, geography and geospatial community to work together on the issues that affect us all. We are pleased to have support from the academic community for our ongoing efforts around data access, education, and sector identity through the Royal Canadian Geographical Society – Canadian Geographic Education and Canadian Association of Geographers Geographic Education Study Group. We’re looking forward to connecting with the CHGIS community on June 20 in Toronto!

Caitlin Blundell,
GeoAlliance Canada

A Canadian Historical Web-mapping User Needs Survey

As you know, the Canadian Historical GIS Partnership Development project is underway to develop resources for conducting historical research in Canada using GIS and other methods, and to explore ways of publishing the results of that research. A prevalent and popular method for doing this is through online mapping technologies. However, many different design approaches and software solutions are being used. We are conducting a survey to investigate current and emerging trends in the use of these technologies, evaluate your experiences and needs as web-mapping users (or potential users), and understand what kind of tools or services you desire for the future.

The survey should take 10-20 minutes of your time, depending how many of the optional questions you answer. It will provide valuable input to direct the efforts of the project. To find out more please go to the survey invitation page on our website:
http://geohist.ca/invitation-user-survey/

Thank you for considering filling out the survey.
Marcel Fortin, Principal investigator
Byron Moldofsky, Project Manager