All posts by Marcel Fortin

Breathing new life into old Historical GIS data

— the benefits of the long-tail of the Ontario Historical County Map Project and the Don Valley Historical Mapping Project data

Most academics who’ve written about Historical GIS have discussed the high-cost of building HGIS projects (Gregory and Ell, 2007). Building any GIS project is an expensive endeavour. Few, however, have mentioned the benefits of the ongoing nature or the extended length of some projects; and the long-term benefits of data projects Ontario Historical County Map Project (OCMP) and the Don Valley Historical Mapping Project (DVHMP) are two projects that have benefitted from the long-tail of their existence in order to continue to develop and enjoy useful applications and use of the long-ago-built (or still being built) historical data.

The OCMP was conceived a few years after the release of the well-known Canadian County Atlas Project at McGill University Libraries in the late 1990s. Nineteenth century County Maps were generally published earlier than the County Atlases. The Atlas project focused solely on the bound maps, and the OCMP focuses only on the earlier large-format maps. Like the Atlas project, however, the main focus of the County Map Project is to allow for the querying of land occupant names found on the maps, and the display of the names on images of the historical maps.

Fortin 2017 3
Canadian Historical County Map Project result of search by Name in Etobicoke Township plate, York County Atlas, 1878

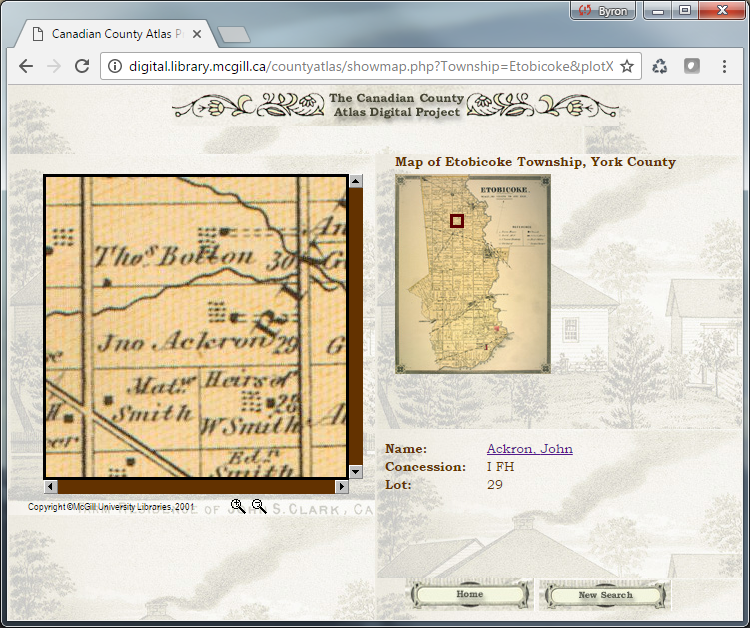
While the McGill project did not use any GIS technology for displaying name information, it did take advantage of the web-technology of its day to graphically lay-out images of the atlasplates, and PHP to link image locations within the database of land-occupant names. The Atlas project was certainly an inspiration to us in developing the Ontario County Map Project.

In contrast to the types of tools used in the Atlas Project, the OHCMP has been a GIS project from the beginning. Like the Atlas Project, however, we also wanted to ensure that users of the County Map project could benefit from web technology to view the maps and GIS data. Being a GIS database, however, a new method of dissemination would need to be used.

Early tests of web technology were pre-Google and used what is now archaic web-mapping software. Our first attempt in 2004 utilized Esri’s ArcIMS (Internet Map Server), made available to us as part of our campus site license with Esri Canada.  We loaded our entire database into ArcIMS as a test, which at the time consisted of only Waterloo and Brant counties. Somewhat surprisingly, we were able to build a sophisticated querying tool and managed to display the georeferenced county map scans in the online map.

Ontario Historical County Map Project rendered in Esri’s ArcIMS software

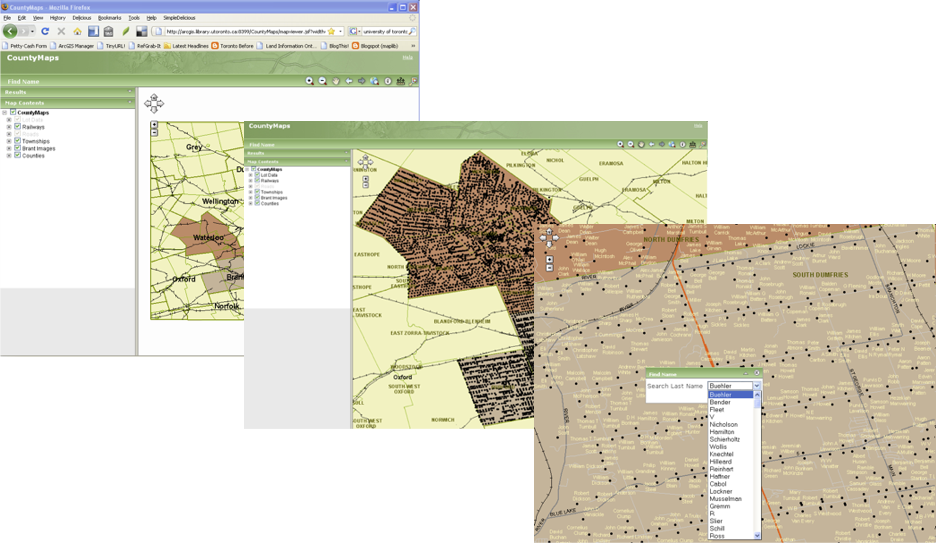
While yielding relatively impressive results for the time (if one were patient enough to wait for results of a query or a zoom-in or -out) it was clear that this setup was less than ideal as the software was extremely difficult to install, very slow to render results, and gave us difficulties finding adequate server space on which to permanently install the software.
Due to the limitations of available software, developing a web map of the land occupant names of the project was put on hold. Of course Google Maps changed the entire web-mapping landscape in 2005. Despite the adoption of Google Maps by many to display their data on the web, our attempts were hampered by the now large size of our land occupant database. While MySQL was often used to work alongside PHP and the Google API at the time, the conversion of our geospatial database into a MySQL database would have been a step back in the GIS development of the project.

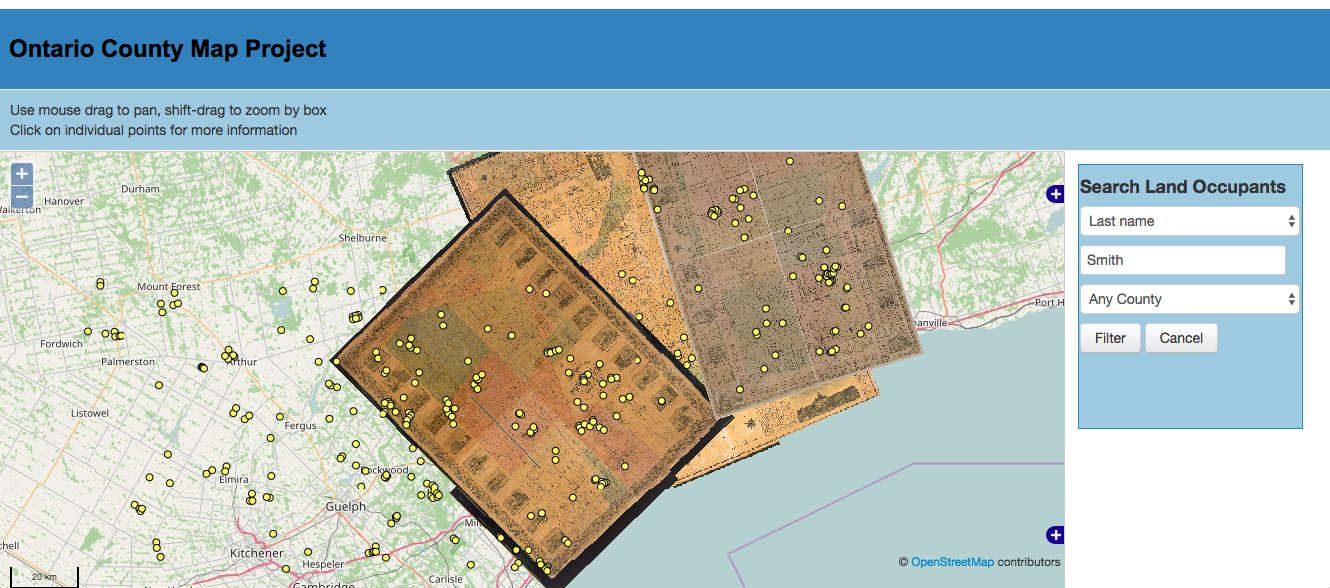
Other more recent attempts at using web-mapping technology in 2013 also included a Mapserver configuration with OpenLayers and a PostgreSQL geospatial-enabled database using PostGIS. While the shapefile data did need to be converted to PostGIS, this setup at least promised the maintenance of our database in a GIS environment, compared to using MySQL. The resulting web-map was very promising, but required quite a bit of coding and manipulation. Having no programmer on the team or any funds to hire one, my programming of the application was limited to a six month research leave and the odd-slow day at the Map and Data Library. Without a programmer, it was clear this solution was less than ideal and would take years to complete.

Openlayers-Mapserver-PostGIS rendition of the Ontario Historical County Map Project

For many years I ignored ArcGIS Online as possibly an overblown idea by Esri. How could one actually build an online tool with GIS functionality and get us to buy into it, I always wondered. However, its popularity grew so much among our U of T users that I eventually needed to learn how to use it to be able to support it. What better way to teach myself how to use ArcGIS Online than to load the County Map Project data, I decided. To my immediate surprise, ArcGIS Online was not only fun and full of great GIS and web-mapping features; it also had the Web AppBuilder application built into it. Along with dozens of Story Map templates, the Web AppBuilder allows you to take your GIS data into a web skin where you can add customizable widgets that work extremely well, even in mobile browsers. Being able to query or filter the 80,000 or so names in our database was a key consideration in adopting any web technology for the project. ArcGIS Online delivered this amazingly well, and also allowed for the rendering of high-resolution images of the scanned County Maps. The ease of use and customization of web apps without the need for coding are also fantastic selling points. Other fun but useful widgets include using animated timelines of “time-enabled” data, and a swipe tool that allows for viewing two datasets on top of the other and sliding a toolbar to switch between displays.

ArcGIS Online version of the Ontario Historical County Map Project with Querying tool display

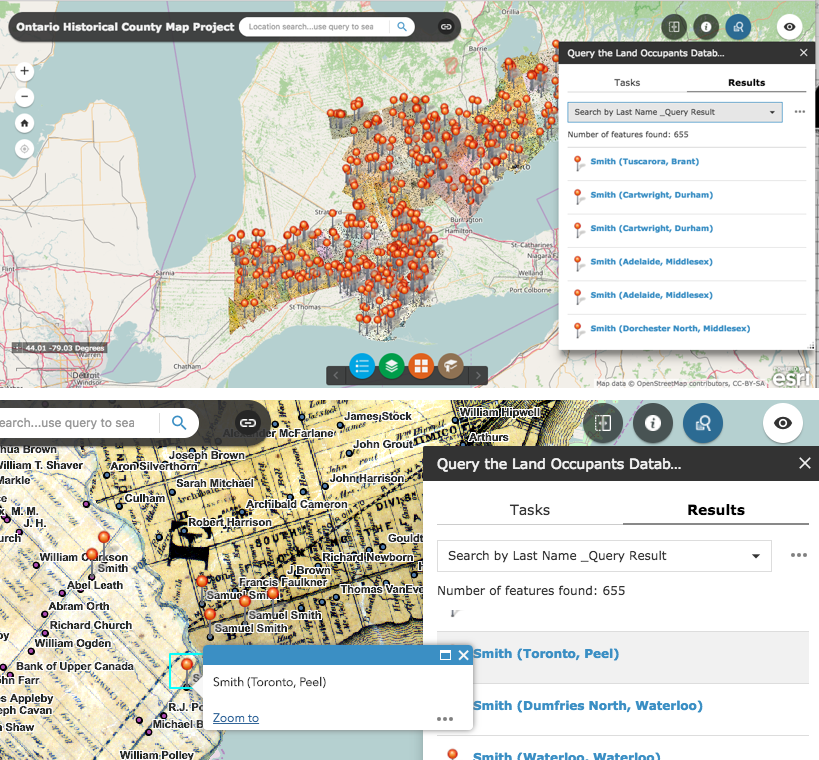
Adopting ArcGIS Online as a web-mapping tool has allowed the project to be out in the public eye where users can actually take advantage of the data built over the past 15 years. I never thought we would have a web-mapping solution before we finished the database, but as it stands, I am pretty happy with most of the functionality of the web app at this point, as our database continues to grow and we continue to compile more land-occupant names from Historical County Maps. Interestingly, while writing this post I actually received three email messages about the project and requests for further information from users of the County Maps site. Without making our data available in this powerful way, I doubt our project would have drawn so much attention.

Inspired by my success with the web-app builder tool, I decided to also build an app for the DVHMP and found that the data we had built over seven years ago really came to life on the web. Being able to query the data and render both polygon and point data together in one view online is empowering.

ArcGIS online is of course not the only tool that has taken advantage of web-mapping and cloud computing advancements to allow users to build their own web map apps. Products such as Mapbox are also increasing in popularity because of their ease of use, powerful functionality and customizability, and the attractiveness of the final map product.

Web Mapping has been around since the 1990s, but with new advanced web-mapping technology like ArcGIS online and Mapbox, it may be time for many other dormant or long-forgotten HGIS datasets to be pulled out of hard drives, or USB sticks to be given new life displayed in easily created yet powerful web maps. I am excited at the thought of possibly seeing the Montréal Avenir du Passé data for instance, available for display on a web map for all to interact with.

The Canadian HGIS Partnership is investigating many web-mapping tools and visualization methods. We are also working with Esri Canada, as part of the GeoHist project, to provide specific HGIS requirements for online mapping tools. With the powerful components already available in ArcGIS online, Mapbox, and other web mapping tools, the future of web-mapping for HGIS is certainly very exciting and accessible to anyone interested in developing them without the need to code.

References:
Gregory, Ian., and Paul S. Ell. Historical GIS: Technologies, Methodologies, and Scholarship. New York: Cambridge University Press, 2007.

On Partnerships

Historical GIS (HGIS) is a challenging and demanding discipline. At the best of times, selecting, scanning, geo-referencing, digitizing and vectorizing the right historical material for a project is a long and arduous investment in both time and money. Because of this investment, researchers are motivated to find pre-built and available data suitable for their projects.

As digital scholarship in the humanities and social sciences evolves, it’s clear that finding others who have done the work of digitizing what you want to digitize, or have scanned what you want scanned, is becoming a necessary part of the academic process. Connecting with other scholars doing what you do is probably more important than ever in an age where digitizing material is only one part of a digital project.

Avoiding duplication is extremely important in many respects. Securing public dollars for undertaking digital scholarship is never guaranteed, and these are getting scarce, so ensuring we are efficient in academia by not duplicating effort is a definite necessity.

Connecting with other scholars and forming partnerships are now necessary to most digital scholarship. This was confirmed to me again recently in the presentations and discussions of the two full-day meetings I participated in this past week with historians, geographers and librarians.

At the Jackman Humanities Institute’s Digital Mapping Workshop, “Mapping Sense, Space, and Time” (https://www.humanities.utoronto.ca/event_details/id=2144) on April 28th, in a session called Collaboration Across Boundaries, presentations by Caroline Bruzelius of Duke University and Natalie Rothman at University of Toronto at Scarborough reminded me of why our group applied to SSHRC to put this Historical GIS partnership together.

In her presentation called “Visualizing Venice: The Life and Times of a Digital Collaboration”, Bruzelius listed seven things digital scholarship requires to move forward. A few of the points she made especially resonated with me.

In her first point she argued that scholars need to be trained in a variety of digital tools. While this practically ensures that scholars do not become experts in most of these technologies, it does, however, lead to better scholarship through asking different questions and thinking differently as a result of varied inquiry.

I think it’s important, as we move forward with our partnership, to remember that GIS is only one tool historians and geographers use in telling historical and spatial stories. GIS needs to be combined with other tools to fully understand the subject at hand and to disseminate our analysis and discourse.

Bruzelius also discussed the importance of open and shared databases of what work has been done. Again, this is something we in the Canadian HGIS partnership felt was one of the most important parts of developing a community of HGIS users and practitioners in Canada. By identifying and helping with the discovery of historical spatial data, we are hoping to prevent duplication and help concentrate efforts efficiently.

Professor Rothman echoed the need for open and shared databases in her discussion on the building of the Serai web site in her presentation called “Building the Serai Collaboratory”. Serai is a free and open online collaborative working platform for scholarship on encounters across ethnolinguistic and religious divides in the pre-modern era (before 16th century.) Serai aims to be a one-stop aggregation for cross-border interaction in the pre-modern world.

Another important point Professor Bruzelius made in her discussion was that Humanists need to tell the public better what it is they do and that they should do this by not only publishing in scholarly journals, but by also making their work accessible to the larger public.

In our partnership, it has been clear from the start that we need input from the public. Historical mapping and GIS is no longer the purview of just academics. Demand from the public for historical maps and digital data was made clear to me during the development of the Don Valley Historical Mapping Project (http://maps.library.utoronto.ca/dvhmp) and the Ontario Historical County Maps Project (http://maps.library.utoronto.ca/hgis/countymaps). With the release of both projects we saw a large demand for more information and access to maps and data generated through the project. Not a week goes by without someone asking me for higher resolution images of the Ontario Historical County Maps!

Because of this public desire for access to historical mapping sources and data, we have in our initial Partnership public participation through The Toronto Green Group, the Neptis Foundation, ESRI Canada, and several academic libraries. Several other public organizations, we hope, will be joining us as the Partnership develops.

From a practical point of view, SSHRC has also made it clear that partnerships with the public are important when applying for grants. We shouldn’t take this requirement as a burden, but instead as an opportunity for community groups and individuals to help us develop better projects through their experiences and by learning from their digital information and data demands.

One of the points Nathalie Rothman also made about the Serai collaborations, struck a chord with me as well. Professor Rothman argued that it is difficult to sustain digital projects such as the ones being presented during the JHI workshop for the long-term without the involvement of librarians. This point was also reinforced in another presentation at this event by Professor Steven Bednarski from the University of Waterloo who relies on the work of librarian Zack MacDonald for the digital mapping of his work on climate and landscape change in medieval England.

I think this is where our Partnership has benefitted from a good start. Not only is our group made up of a humanists and social scientists, it is also loaded with a dedicated bunch of librarians from across the country. Academic Map and GIS Librarians, and now also Digital Humanities Librarians as well, tend to be specialists. Not only can they support digital projects through long-term preservation, but they can also, in many cases, contribute to the scholarly undertaking of many projects.

Earlier this April, At the annual meetings of the Ontario Council of University Libraries’ (OCUL) Geo group, I was also reminded of why our group undertook this Partnership Development Project. In this forum, where all GIS and Map librarians from universities meet to discuss common issues across the province, I was struck by the similarity of the discussions we were having to those in the partnership group. Not only do we also struggle with the demands of digital scholarship and project development, but we also struggle with our approaches to making our work visible to the public.

In 2015, the Geo group applied and received funding from OCUL directors to scan and geo-reference 1:25,000 and 1:63,360 federal historical topographic maps of Ontario held in our collections. The project is winding down as most maps have now been processed through work at McMaster University, Ryerson University, the University of Waterloo, Western University, and Carleton University. The interesting part of the discussion during the day surrounding this project was that the group felt it may be a good idea to partner with other organizations in order to develop a data dissemination tool. A tool that would make the data available to not only OCUL schools, but to the rest of the world, especially in light of public demand for historical maps and data.

As well, the group discussed at length the issue of the growing interest in the topic of Research Data Management for spatial data created at Universities. One of the points that was made was that it is difficult to make data, once ingested in data curation systems, discoverable and accessible to the rest of the world. It is a growing concern as all institutions will most likely be building their own repositories using a variety of technologies as demand grows. In building these repositories, will discovery and interoperability be required? We are not sure. If discovery is not at the forefront of requirements in building these repositories, much of the work by researchers and librarians to build datasets could potentially be lost without systems that branch out over a variety of institutions and locations to allow for interaction between search tools.

Part of the reason for our Partnership is to investigate building discovery tools that do speak to one another and that will avoid duplication. ESRI Canada has partnered with us and we are hopeful that, following the two years of this grant, we will be in a position to recommend how we can build data discovery tools that connect to each other for maximum visibility and that will ensure data sustainability and re-use.

It’s reassuring to know that the academic and librarian communities are both having similar discussions on the topics of partnerships and data discovery. It’s also reassuring that the purpose and needs we had identified in building this Canadian HGIS partnership last year, are the same these two communities are expressing.