Category Archives: Innovative visualizations

QGIS Lovell in Montreal CROP

Montréal Market Vendors ca 1880 web-mapping pilot project

Quicklinks:
Open Source demonstration web maps (using Carto.com):
Lovell in Montreal City Directory 1880-81 base map
https://canadian-hgis.carto.com/builder/70212344-415a-11e7-9fef-0e3ff518bd15/embed
Final Map of Market Vendors Work and Home – With Widgets
https://canadian-hgis.carto.com/builder/a20b5b37-52ed-417b-b6fa-f73d618d6fcd/embed
ArcGIS Online demonstration web maps:
Lovell in Montréal 1880 Basic Web App: Original layers and ArcGIS Basemap
Montréal Market Vendors Work and Home ca 1880 Filtering App
http://hgisportal.esri.ca/portal/apps/MapAndAppGallery/index.html?appid=f081eb9a363c46caa37c77d132def423

For detailed pilot project development documents see links at end of this article.

Montréal, l’avenir du passé (MAP) has been a landmark project in Canadian historical GIS. Professors Sherry Olson, Robert Sweeny and their collaborators at McGill University recorded, mapped and analysed many of the data sets basic to understanding the context of urban history for Montréal in the 19th century: the urban fabric including building type from historical maps from 1825, 1846 and 1880; demographic data from a number of Censuses; information about local residents and businesses from City Directories. Their website, based at Memorial University, goes into details about these data and the various applications which have been made available for researchers and students to explore them. (http://www.mun.ca/mapm/)

However, as part of the open discussion at our Geohistory/Géohistoire project meeting in August of 2016, our collaborator Robert Sweeny expressed his disappointment (if I may paraphrase) at what might be called the failed promise of online mapping. Interactive mapping and GIS tools should not limit users to viewing pre-digested results of research, much as printed maps were able to do. These tools should allow active exploration of historical GIS-enabled data, including posing new or unanticipated questions, drawing out new or unanticipated spatial relationships – in short, allow the user to use GIS tools to explore and analyse data, in an online environment.

Many voices rose from the audience to assure Robert that online GIS applications and tools were under development at that time, and would soon enable the kinds of inquiry that he envisaged and expected. And truly, these tools have been emerging in the last year or two, both in the Open Source community and in the ArcGIS Online world. Robert may have been somewhat skeptical, but he remained ready to be convinced. And so when looking for pilot web mapping projects for our partnership in late 2016, we approached him with a question: would he come up with a scenario for proving the case that online GIS tools had come of age? That what students in his classroom had always needed full GIS software programs to achieve, could now be completed using a web browser?

What Robert responded with was a “Scenario for markets based on MAP’s 1880 Lovells QGIS application,” which appears as Appendix 1 in the full-length development documents for which links appear below. To quote a relevant section:
“As is still the case in many parts of the world, people in 19th century Montreal bought most of their food at markets… From west to east St Gabriel, St Antoine, St Anne, St Laurent, St James and Papineau wards each had their own market, while Marché Bonsecours on St Paul Street served as the main market…. In the Lovell’s city directory it was frequent for people who leased stalls in the retail markets to also list their home address. These addresses are an indication of how local the ward markets were. In this exercise we will be comparing this residential information with other variables to assess the character of these differing markets.”

The “other variables” Robert’s scenario is most concerned with are Occupational. He outlined a method using QGIS for drawing connecting lines between the work locations for Market vendors, and their residential locations (as well as these could be determined.) He then suggested different occupation types might have different residential patterns relative to the market work locations. Or perhaps different markets would exhibit more local or more far-flung connections to vendors’ homes. Identifying these locations and drawing the connecting lines between them opens up a wealth of analytical possibilities.

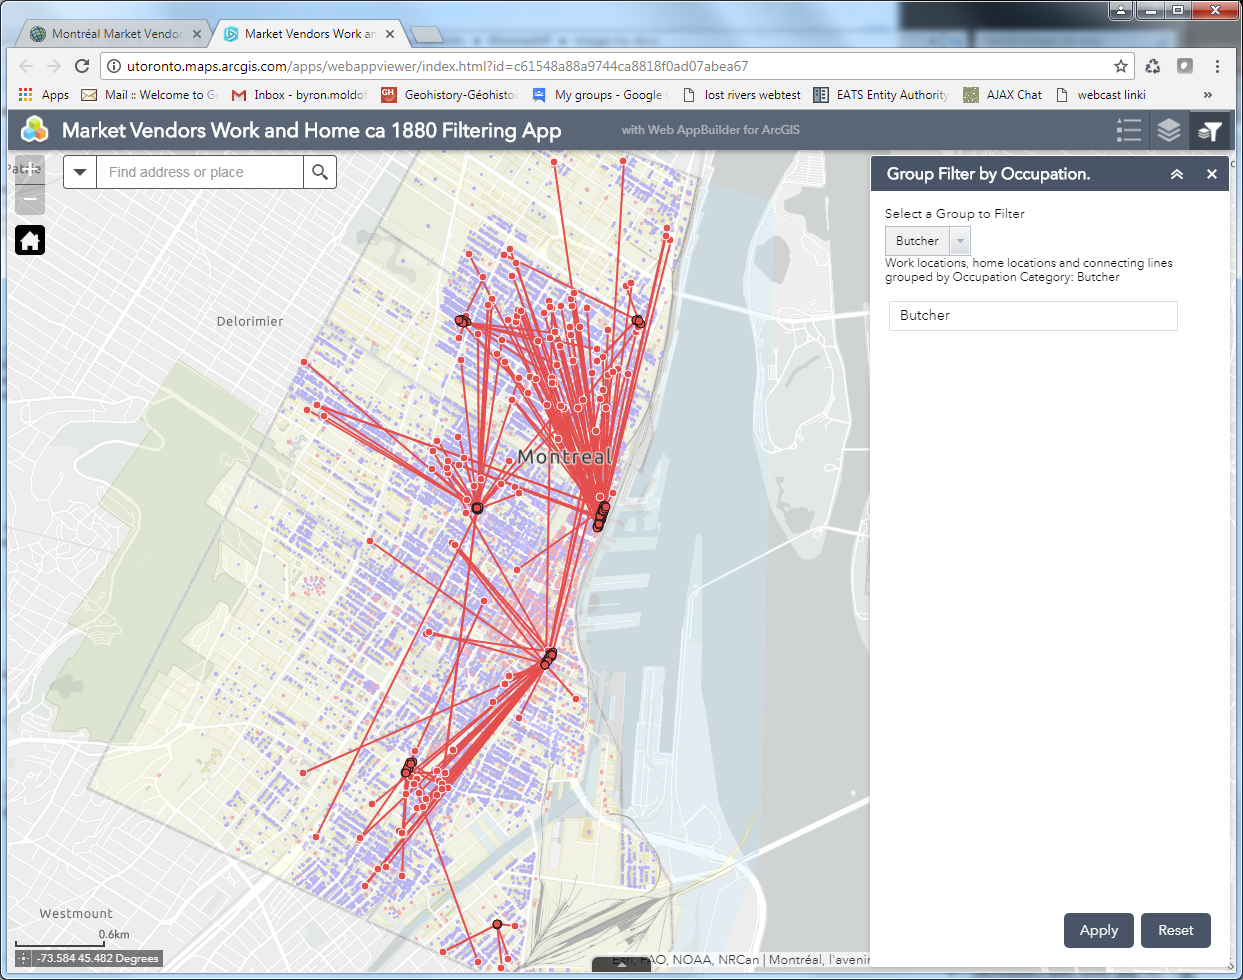
So this is what we attempted to do, first using the Open Source Carto tools, and then using ArcGIS Online. The resultant web maps illustration vendors’ work and home sites look remarkably similar (as one would hope!) Quick default views of these are pictured below: the Carto map showing all of the occupational categories, the ArcGIS Online map showing the symbols and lines just for “Butchers” in the markets.
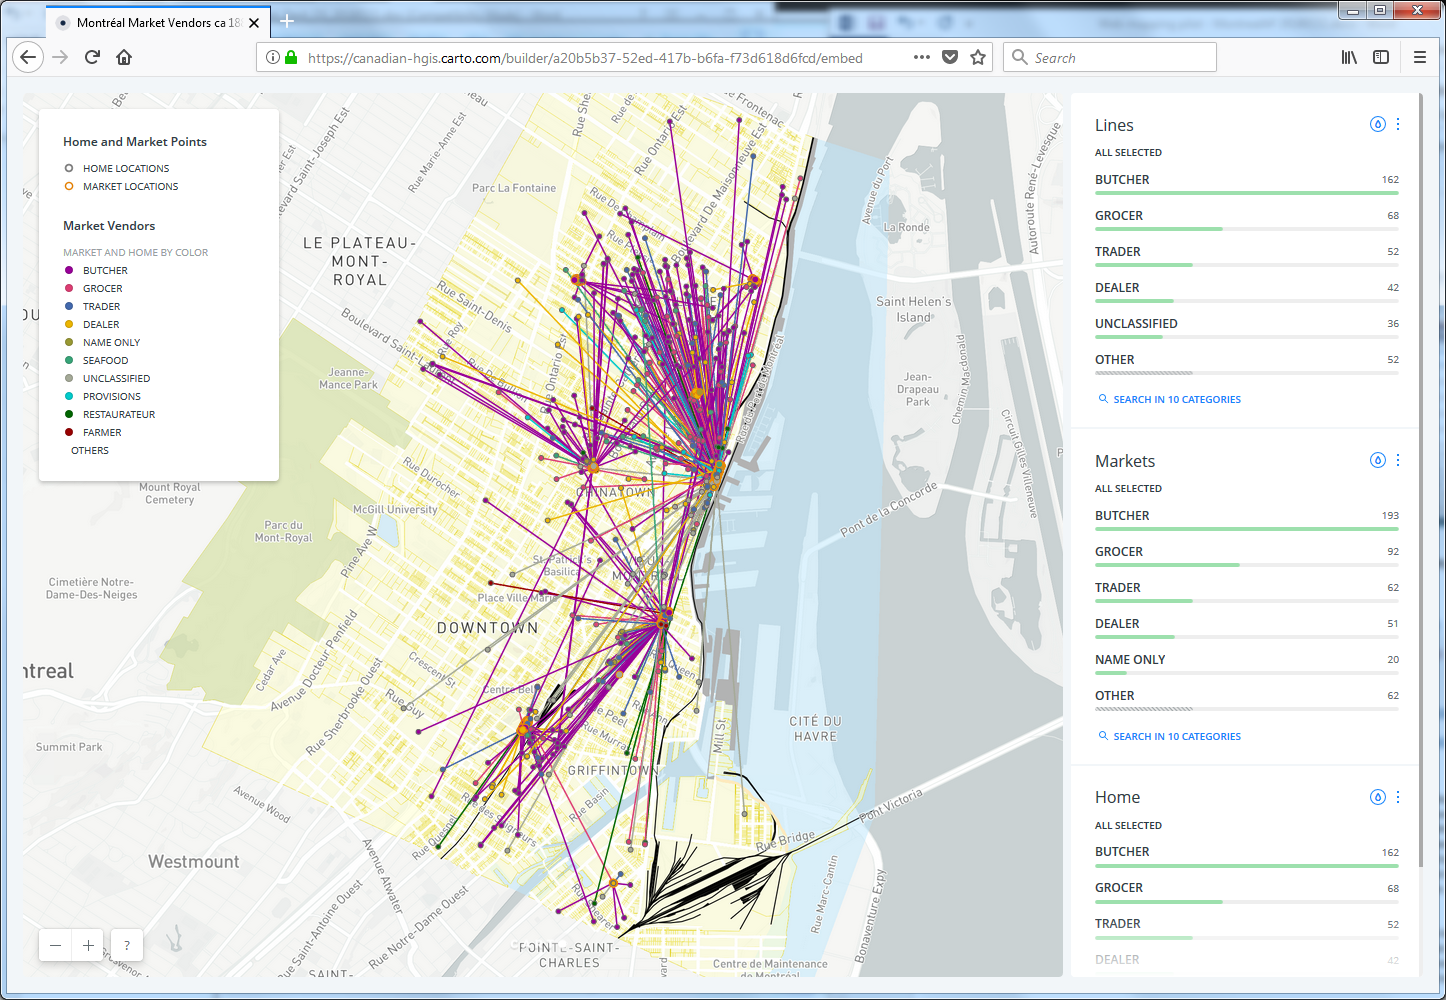
Carto user view showing ALL vendors and connections
ArcGIS Online App filtered to show points and connections only for "Butchers"
ArcGIS Online App filtered to show points and connections only for “Butchers”

A side note: Unlike our other pilot projects, which focus on functionality and customization of coding for map design and presentation, this project is primarily about enabling the user to analyse and explore data interactively. Therefore rather than a breakdown of the code required to produce a final web-map, our detailed documentation consists of the step by step process for using the latest online tools from Carto.com and ArcGIS Online (as of mid-2017) to achieve the objectives of the exercise.

There are similarities, and there are differences, in how the two toolsets approach the tasks at hand, and the final products are certainly distinct. More similarities than differences exist though – which often prompts an intriguing conversation many of in online mapping have had: who’s following whom? No space to explore that question here, but feel free to post your own comments below.

Some of the similarities are superficial. For instance, the tools to achieve these products are fairly recent additions to their online toolboxes. Both software suites number these among what they both call “Analysis” tools. Their menu-driven editing interfaces look similar, as pictured below. Carto uses an Carto Builder “Analysis” tool called “Connect with Lines”, to create connections between point locations. ArcGIS Online uses an “Analysis” tool named “Connect Origins and Destinations”, to achieve a similar outcome. However, the AGOL tool is actually built to do network analysis and routing, and has much more sophisticated potential applications, whereas the Carto tool is limited to making straight line connections between points.
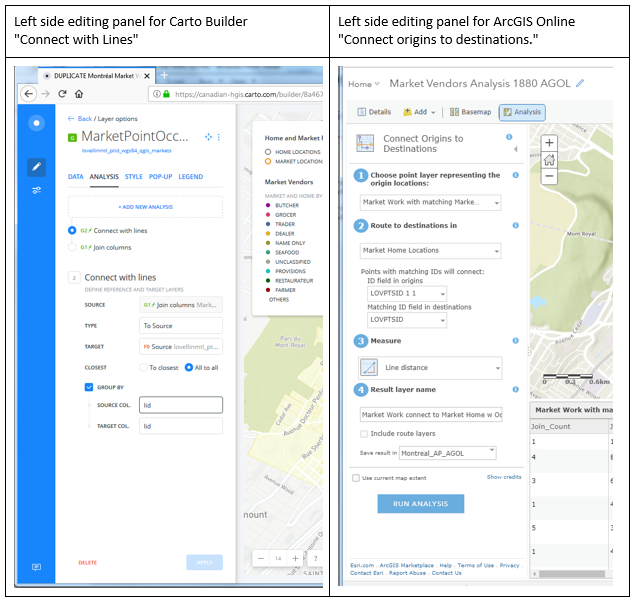
Table Connect with lines AGOL and Carto

Despite the relative limitations of the Carto tool, it does achieve the outcome required by this project – and the flip side of its simplicity is that it proved to be easier to use, and much more forgiving in terms of its data requirements than the AGOL tool. For example, the Lovell Montréal data set of work and home locations turned out to have many more work locations than homes – not all market workplaces had identifiable matching home locations. And some market workplaces had many more than one “home” location associated with them. The Carto tool sailed through these discrepancies, and drew lines between all the matching points without any issues. The AGOL tool on the other hand, popped up the following error messages, in turn:

AGOL O-D error message table
ArcGIS Online error messages for Origins-Destination

So in order to make the AGOL Origin-Destination tool work for our purposes, some significant data manipulation had to be completed – this is all described in the detailed documentation for those who are interested.

This is NOT to say that obliviousness to data discrepancies is always a virtue – trouble-shooting the data issues for the AGOL tool provided a much better understanding of which work points were actually connecting to which home points. Rather, it is just to say that, as usual, one must make sure that for any analytical task, the right tool for the job is identified and used.

In my estimation, both AGOL and Carto now provide the interactive online tools to map the data, and to allow the analysis for at least this specific scenario, that Robert Sweeny had desired for his students and other users of the Montréal, l’avenir du passé project data. However the question remains: is this an effective environment for doing this kind of work? GIS and other software providers are putting more and more functionality into browser-based “software as a service”, delivered online. The advantages are clear: any browsing device can access these GIS tools, nothing has to be installed locally, resulting in much broader access for users. The disadvantages: limitations in processing tools, limitations in interface and symbol design, and limitations in number of views allowed without paying fees. The question of what is best for any set of students or other users, requires a balancing of these issues.

Please feel free to post comments discussing these pilot projects using the space below.

For more detailed information about the work done on these pilot project web maps, we have mounted our technical development documents on this site, linked below.

LINKS TO DOCUMENTATION

Montréal Market Vendors ca 1880 Open-Source Development Document

Montréal Market Vendors ca 1880 ArcGIS Online Development Document
MapboxGrowthmap

Historical Atlas of Canada Population by Census Divisions 1851-1961 Web-mapping Pilot Project

Quicklinks:
Open Source demonstration web maps (using Mapbox, JQueryUI):
HACOLP Population Growth, Density, Distribution – by Census Division 1851-1961
http://mercator.geog.utoronto.ca/georia/mapbox-hacolp
ArcGIS Online demonstration web maps:
HACOLP Population Density by Census Division 1851-1961 Time Aware Apps (3 versions)
HACOLP Population Growth by Census Division 1851-1961 Time Aware App
http://hgisportal.esri.ca/portal/apps/MapAndAppGallery/index.html?appid=f7e6329dd6b3494b9b689e1750cf6781

For detailed pilot project development documents see links at end of this article.

The Historical Atlas of Canada was a three-volume collaborative research and publishing project, finished in 1993, which used maps, text and other graphic displays to explore themes in the history of Canada. A selection of the Atlas thematic “plates” was published online in 2008, using Esri’s ArcIMS technology, as the Historical Atlas of Canada Online Learning Project (HACOLP.) For more general information about that project see: http://www.historicalatlas.ca/website/hacolp/about.htm

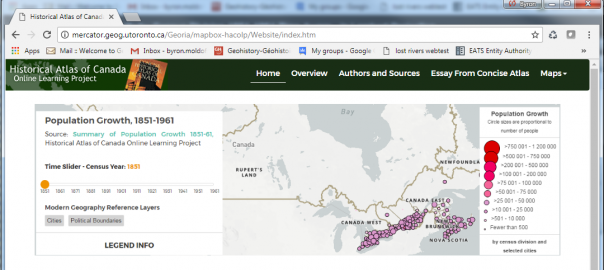
One of the major themes explored in the Atlas was the sweeping population changes across the country through the century prior to the Atlas’ end-date of 1961. A number of demographic measures were used for different maps, periods and sub-regions, but when the HACOLP was put together, it was decided to create a chapter called Summary of Population Growth, 1851-1961, which would allow users to look at how change occurred over this whole period, contrasting three different cartographic representations.

The original website featured three interactive maps of population by Census Division, using three different symbolization methods: Population Density (choropleth), Population Growth (graduated circles) and Population Distribution (dot density) – for eleven Canadian census years, 1851 through 1961. These maps used the ArcIMS technology, and a customized Javascript legend using checkboxes to turn each year on or off.

The goal of this pilot project was to create new web maps to rejuvenate and improve the original maps, in performance and visualization. Using data provided by HACOLP, these maps have been reproduced for this pilot project while being updated to current web-mapping standards, and implementing a Time-slider tool to click through the census periods, replacing the original checkbox interface. We also envisaged this project as an appropriate one to use to explore the web-mapping software’s capacity for legend design flexibility, and for map projections other than the standard Web Mercator.

As planned for this project, we designed and produced two different versions for each of these map themes:  one using the ArcGIS Online platform and another using Open Source software and web serving tools, in this case primarily the Mapbox and JQueryUI javascript libraries.

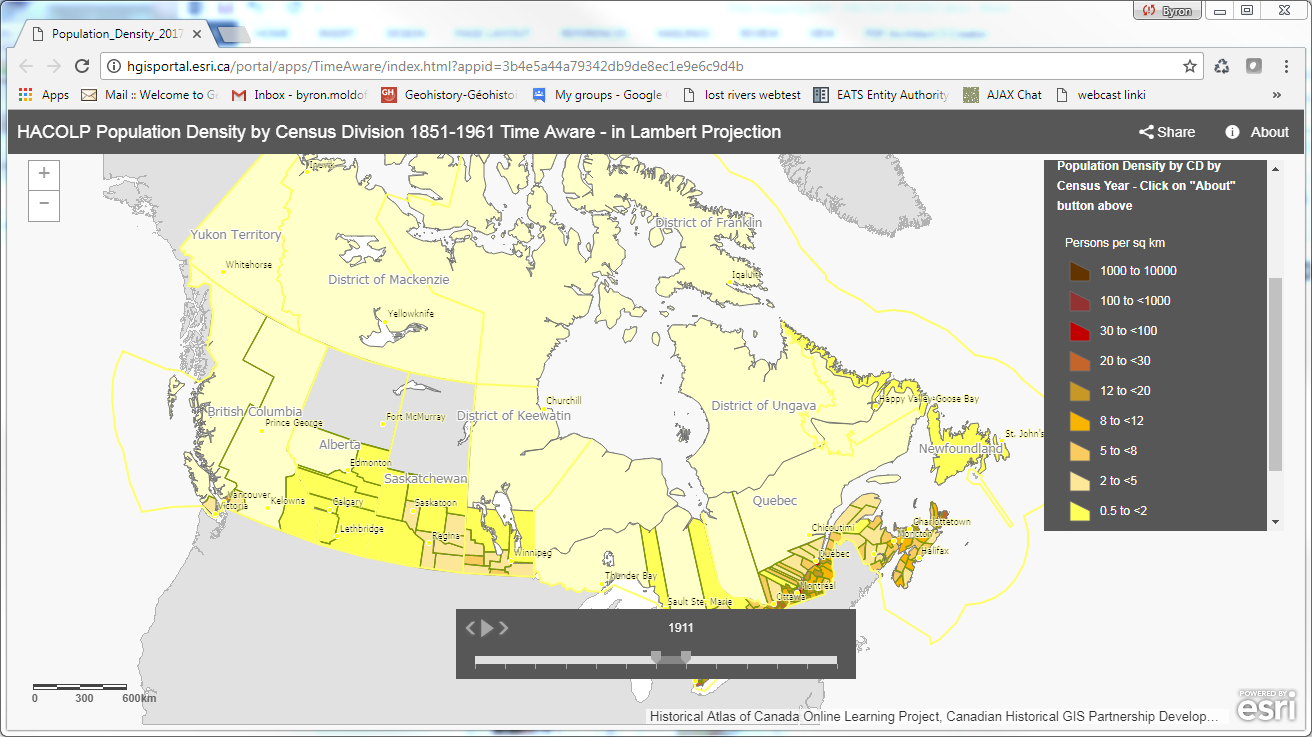
The ArcGIS ONLINE VERSIONS can be found on the Geohistory-Géohistoire Canada Development Portal (technically an ArcGIS Enterprise portal) hosted online by our partners at Esri Canada, at: HACOLP Population Apps Gallery. To view other Portal content go to: http://hgisportal.esri.ca/portal/home. The “Gallery” contains 4 apps: one for Population Growth (graduated circles), and three versions of  Population Density (choropleth) – one in Web Mercator, another in Lambert Conic Conformal, and the third using an on-the-fly tile generating configuration, for comparison of performance. We also made a version of the app to test the “Optimize Layers” procedure, available in ArcGIS Online but not in the Portal environment. These comparative methods are explained in the detailed ArcGIS Online Development Document (see link below) – you can view them to compare their performance for yourself. The Lambert version highlights the capacity for alternative projections in ArcGIS Online, which are rather easily done. On the other hand, Dot Density mapping was not readily possible using the tools at hand.
ArcGIS Portal Population Density Map using Lambert Projection

The Mapbox versions of the HACOLP maps are being hosted on a server in the Department of Geography at University of Toronto. We were able to generate maps for all three types of representations using Mapbox. However, it does not provide support for projections other than Web Mercator. The maps have been put into a single home page displaying images of each, with mouseover links to the interactive maps. They can be found here: http://mercator.geog.utoronto.ca/georia/mapbox-hacolp.

Mapbox is a cloud-based open-source mapping platform for custom-designed mapping. It is built on vector tiles for rendering maps, and they developed this format, “an advanced approach to mapping where data is delivered to the device and precisely rendered in real-time.” (www.mapbox.com/maps) Vector tiles provide a vector version of the image-tiling technology that Google used to revolutionize web mapping performance. Esri and other industry leaders are now using vector tiles for their base mapping.

Mapbox provides a number of easy to use tools for online map and data management and map composition, like ArcGIS online. However it is still primarily an Open Source development environment, providing customization through a number of Developer Tools (SDKs and APIs) which are summarized online here:  https://www.mapbox.com/developers/  For newcomers to Mapbox, our OS Development document, linked below, provides an “Overview of the Workflow in Mapbox” (pp. 3-4) that we used for creating the pilot project web maps.

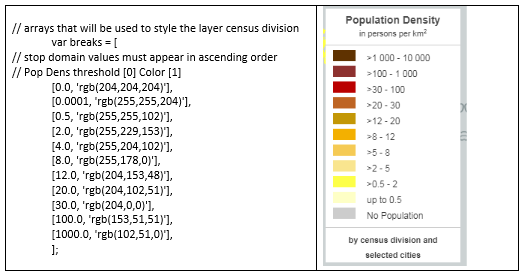
One of the areas where Mapbox is rather Do-It-Yourself, is legend composition. As opposed to ArcGIS, where legends are easy to include but rather inflexible, Mapbox leaves you as a designer pretty much on your own. Therefore we undertook the challenge to create code to generate a legend based on the same array set up for classifying map data. So for

Choropleth legend array as coded in Mapbox

example, when a colour array is set for choropleth classes, a legend is generated automatically that inherits the symbols set. This is detailed in the OS Development document, under “Data driven styling and automated legend creation”, pp. 12-15, and a template is provided on GitHub.

For both ArcGIS Online and Mapbox versions, overall we found that performance improvements in speed of display were not as great as we had hoped. The Census Division polygons and linework are complex, even when generalized and optimized for web deployment, and serving these up is slower than one might wish. We experimented with various suggested fixes for this, in both software suites, but met with only moderate improvements. If you have comments or suggestions about these issues, or any other design aspects of the pilot projects, please feel free to post comments and discussion below, or to contact the author at byron.moldofsky@gmail.com.

For more detailed information about the work done on these pilot project web maps, we have mounted our technical development documents on this site, linked below.  Also, for the Open Source coding we have posted the code used and some example “templates” on GitHub.

LINKS TO DOCUMENTATION

HACOLP “Population by Census Divisions” maps Open-Source Development Document

HACOLP “Population by Census Divisions” maps ArcGIS Online Development Document

For the code for the Open Source site, see:  HACOLP Github Open Source Repository

Lost Rivers OS site

Lost Rivers of Toronto Web-mapping Pilot Project

Quicklinks:
Open Source demonstration web maps (using Leaflet, JQueryUI):
Lost Rivers of Toronto – Disappearing Rivers – Timeline
Lost Rivers Ashbridge’s Bay Area Walks scrolling map tour (3 walks)
http://mercator.geog.utoronto.ca/georia/lostrivers/
ArcGIS Online demonstration web maps:
Lost Rivers of Toronto – Disappearing Rivers – Timeline App (2 versions)
CHGIS Lost Rivers – Ashbridges Bay Story Map (McMurrich 1882) App
http://hgisportal.esri.ca/portal/apps/MapAndAppGallery/index.html?appid=3272511933fa41498201836717b41a27

For detailed pilot project development documents see links at end of this article.

The Lost Rivers Walks project (http://lostrivers.ca/) takes people on guided walking tours around the city of Toronto “…to create an appreciation of the city’s intimate connection to its water systems by tracing the courses of forgotten streams, by learning about our natural and built heritage and by sharing this information with others.” They are one of the community partners of Geohistory-Géohistoire Canada. For many years they have been using historical cartographic and other archival sources, interviews with long-time residents, and on-the-ground encounters with the topographic peculiarities of the city to draw the map of Toronto’s drainage pattern as it must have been before the city-building process forced much of it underground.

With Helen Mills and John Wilson representing the Lost Rivers project, we decided to create web-maps for this pilot project on two different themes:
1. Disappearing Rivers of Toronto:  A map of the city of Toronto showing the original stream network of the city, and how those streams disappeared over time as they were buried for purposes of development.
2. Lost Rivers Ashbridge’s Bay Area Walks:  A series of interactive maps dynamically illustrating the stops along the way for three of the walks offered by Lost Rivers in this area of Toronto’s eastern waterfront, linking the locations of the stops, and pictures and text related to each, in a “map tour” format.
Links to all of the maps are embedded below.

As planned for this project, we designed and produced two different versions for each of these map themes:  one using the ArcGIS Online platform and another using Open Source software and web serving tools, in this case primarily the Leaflet and JQueryUI javascript libraries.

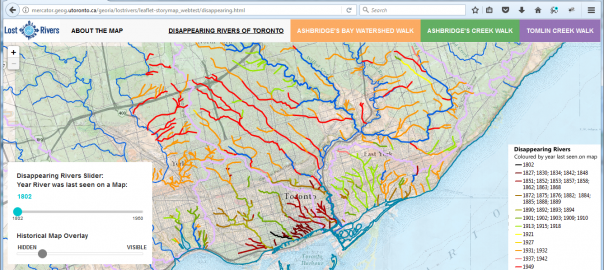
The ArcGIS ONLINE VERSIONS can be found on the Geohistory-Géohistoire Canada Development Portal (technically an ArcGIS Enterprise portal) hosted online by our partners at Esri Canada at: Lost Rivers of Toronto Apps Gallery. To view other Portal content go to: http://hgisportal.esri.ca/portal. The “Gallery” contains 3 apps. This is because there are two versions mounted of the Disappearing Rivers of Toronto app. One is hosted on the portal itself, using a “standard” timeline slider to turn the rivers off as they “disappear” over time. That timeline slider looks like this:
ArcGIS_standard_timeline
This version of the app was built using ArcGIS Online Web AppBuilder, which is a very user-friendly tool which allows authors of web maps to drag and drop user interface components like this standard “Time Slider” widget into their web app. The widget can even be configured specifically for one’s map and data, in limited ways, such as the icon that is used for the tool, and whether the time-specific layers are indicated above it.
For more info on the Web App Builder see: http://doc.arcgis.com/en/web-appbuilder/

However, more sophisticated customizations which may be desired, or even necessary, are not possible. For example, the slider has two “handles”, set at 1830 and 1840 in the picture above. Each one can slide forward or backward along the timeline independently, to select a “range” of data. This design is very appropriate for some applications – however when the goal is to illustrate a “snapshot” of the environment at a single point in time – like our “Disappearing Rivers” map – it can be confusing, and the resulting map may be unclear. A slider design offering only one handle to the user, identifying a single point in time, like the picture below, simplifies and clarifies the interface.
ArcGIS_custom_timeline

This customization was only made possible by hosting the app on an independent server (i.e. not on ArcGIS online itself, or the Geohistory Portal) and using the Developer Edition of the Web AppBuilder for ArcGIS (https://developers.arcgis.com/web-appbuilder/). This is a rather complicated process requiring the installation of the development app on a local computer, registration of the app on the Geohistory Portal so that portal-based web maps may be incorporated, development and testing of the app and customizations on the local computer, deploying the app on the independent server, and then registering the final app on the Geohistory Portal so that it is accessible there.

The OPEN SOURCE software versions of the Lost Rivers maps are being hosted on a server in the Department of Geography at University of Toronto.  The maps are incorporated into a single web page with top-bar links to the Disappearing Rivers map, and each of the Ashbridge area walks. They can be found here: http://mercator.geog.utoronto.ca/georia/lostrivers

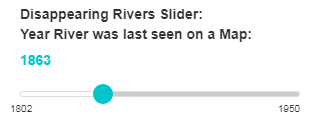
In contrast to the ArcGIS Timeline slider, the Timeline slider used for the Disappearing Rivers map is one of a set of generic JQueryUI slider tools, adapted for the specific needs and time frame of our map. (http://jqueryui.com/slider/) The version we arrived at looks like this:
JQueryUI_custom_timeline_lostrivers

Working with generic Javascript tools has pros and cons. The advantages have to do with the transparency of the coding related to design. The JQueryUI API documentation is thorough and the techniques use fairly basic Javascript and CSS coding. We were able to adapt the tool and tweak the graphic design of it without much problem. The ArcGIS Web AppBuilder widgets, although fully available for customization, use a more complex design framework and the Dojo Toolkit (https://dojotoolkit.org/), so are not as accessible to less-than-expert programmers. And as described above, the system the ArcGIS templates are embedded within and the workflow required, is rather complicated. In comparison to customizing the ArcGIS Web AppBuilder App, the workflow involved in developing the Leaflet-based site was extremely simple. Documents could be written and tested on local drives, and uploaded to a web server when completed.

The disadvantage of working in the simpler generic environment is a reduction in functionality, what could be termed the native intelligence of the application. In this context, using GeoJSON for the Rivers overlay there is no concept of “time-aware” data. The line data is displayed based on a simple query of the integer field value, in this case the “Year last seen on map”. This worked fine for our year-based attribute data, but any more sophisticated queries based on chronology, or using a variety of time formats, could be very problematic to code, or at least more complicated to integrate into the interface.

There is not enough space here to go into the production of the Lost Rivers Ashbridge’s Bay Area Walks web maps, but a similar process occurred regarding ArcGIS Online and parallel Open Source development. For more detailed information about the work done on these pilot project web maps, we have mounted technical development documents on this site, linked below.  Also, for the Open Source coding we have posted the code used and some examples on GitHub. For further questions about the projects, please feel free to post comments and discussion below, or to contact the author at byron.moldofsky@gmail.com.

LINKS TO DOCUMENTATION

Lost Rivers Toronto “Disappearing Rivers” Map Open-Source Development Document

Lost Rivers Toronto “Disappearing Rivers” Map ArcGIS Online Development Document

Lost Rivers Toronto “Ashbridges Walks Maptour” Open-Source Development Document

Lost Rivers Toronto ” Ashbridges Walks Maptour ” ArcGIS Online Development Document
For the code for the Open Source site, see: Lost Rivers Toronto Github Open-Source Repository

Neptis Geoweb 4

The Neptis Geoweb: A behind-the-scenes look into the underpinning framework

Guest post by Vishan Guyadeen, Neptis Foundation. Neptis is one of the collaborating partners of the Canadian Historical GIS project. 

The age of data is upon us. Data from different fields, quality, and types have become more and more available. However, in many cases it can be hard to glean valuable information from data because one might not be able to easily visualize and/or compare it with other datasets.

In studying the forces that make up and shape urban regions, it is particularly difficult to contextualize data since it exists in many different places.  The Neptis Geoweb is an interactive mapping and data visualization platform that aims to address this issue. Specific to the Toronto region, the Geoweb utilizes data that is normally siloed in various government organizations to make the complex policies shaping the region more accessible and easier to understand.

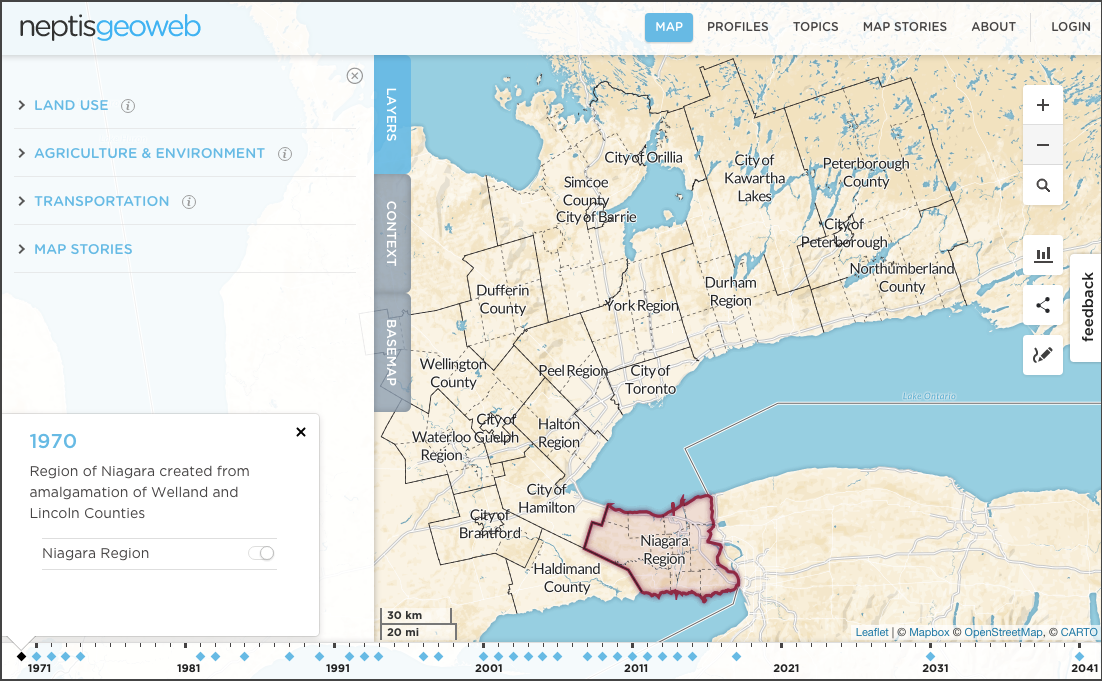
One subject that requires data that is often difficult to obtain, understand and visualize is the history of the Greater Golden Horseshoe. The Neptis Geoweb has a unique feature – the Timeline, which guides the user through milestone policies/events that have helped to shape the region into its current state. The Timeline is an interactive feature that describes and visualizes milestones in the regional context. Users may also compare these historical map layers with other current and historical datasets for further context.

Neptis Geoweb showing historical information about Region of Niagara, keyed to timeline below map

Creating a platform that is capable of showcasing and managing large quantities of data is not an easy undertaking. The Neptis Geoweb was built with a fully customized framework, which allowed for easy access, clear and up-to-date data, as well as the ability to maintain different types of content (e.g. maps, charts, and text). There are two main underlying components that make this possible.

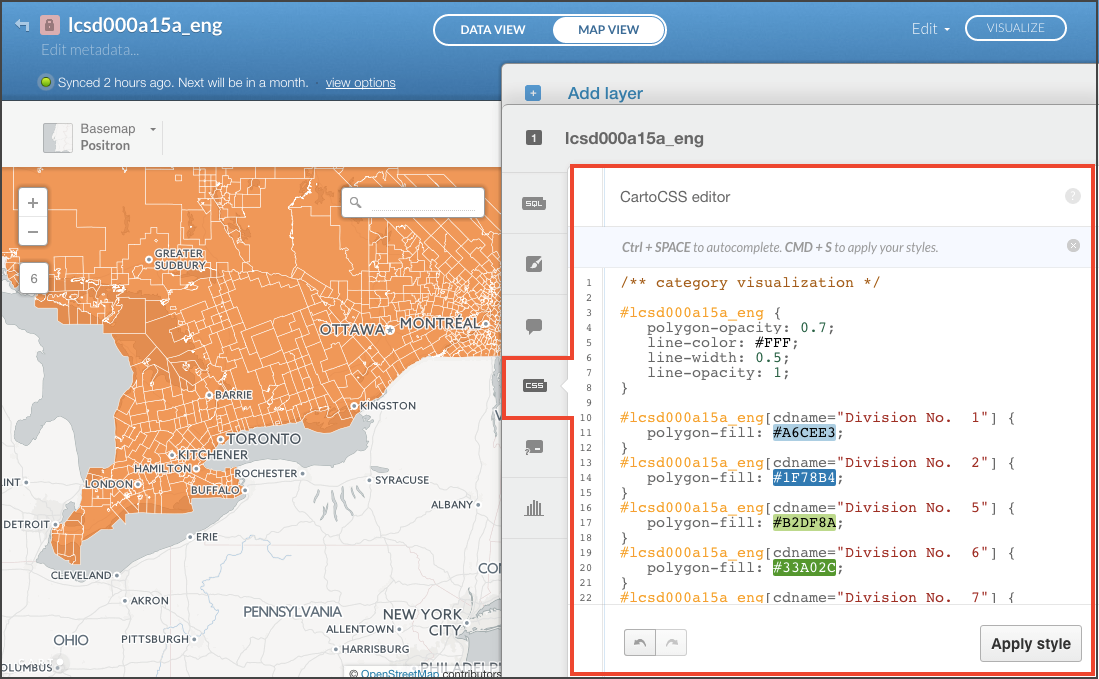
First, the most important component of the Neptis Geoweb is Carto (formerly CartoDB). Carto is a cloud-based GIS platform that houses and queries all of the data layers on the Geoweb. Carto was utilized because it is a powerful and flexible platform that is easy to use. For example, Carto provides the ability to quickly manipulate data in the cloud using SQL and also visualize spatial data using either a user-friendly wizard interface or an advanced CartoCSS editor (see screenshot below). Further, Carto provides the Geoweb with the flexibility of using various data types and the ability to seamlessly interact with other platforms such as Leaflet, MapBox, and OpenStreetMaps. These additional platforms enhance the overall functionality of the Geoweb. Carto offers these and many other benefits to the Geoweb while maintaining an overall ease of use that doesn’t always require a GIS professional.

Carto graphic interface for editing layer graphics using CartoCSS (one of several methods)

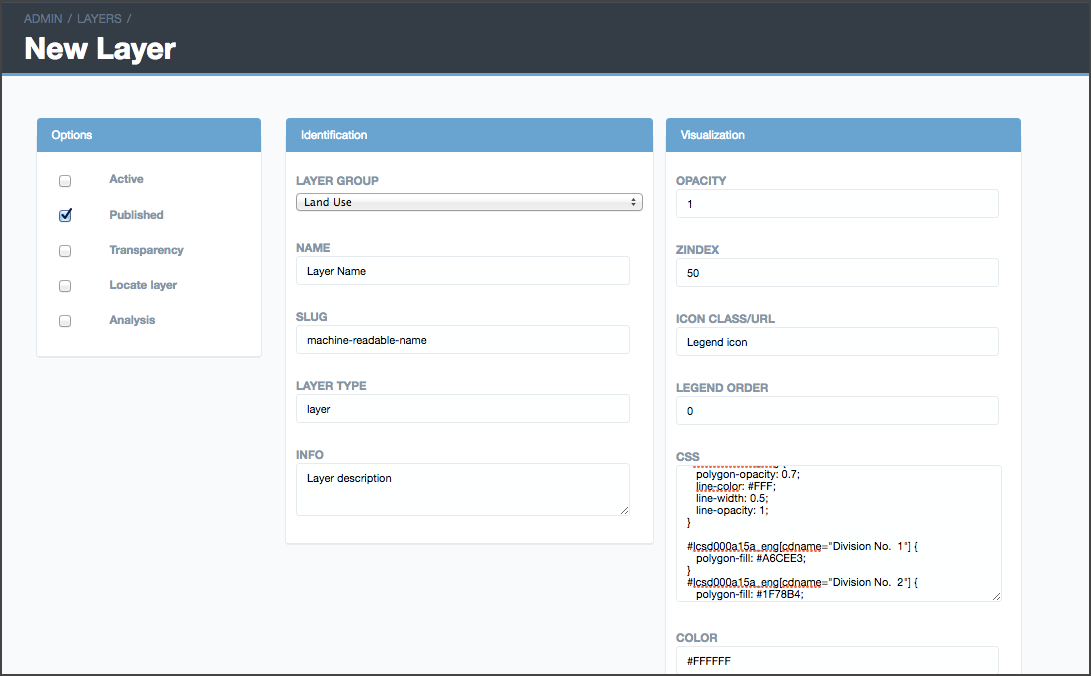
Second, the administrative interface of the Neptis Geoweb was custom-built by Carto developers, to organize and maintain map layers and other non-spatial content. Neptis staff are able to prepare, organize and maintain content such as map layers, municipal data profiles, and short topic stories. When dealing with large quantities of raw data and map layers, it is essential to have a way of managing content. The admin interface contains simple forms that make up the content shown on the Neptis Geoweb. The screenshot below shows part of the form that is required when creating and updating map layers.

Neptis Geoweb custom administrative interface - form for New Layer
Neptis Geoweb custom administrative interface – form for New Layer

This is a brief introduction to the Neptis Geoweb and the two main components that make it an efficient platform. Like Carto and web mapping as a whole, the Neptis Geoweb is an evolving project. As more data becomes available – whether relating to local areas, the region or beyond, the intent is to continue to enrich the Geoweb.

North Saskatchewan River flowing through Edmonton, Alberta

Whose ‘Ribbon of Green’? HGIS and the Histories of Edmonton’s River Valley and Ravines System

By Mo Engel, Shannon Stunden Bower, Andrew Tappenden, and William Van Arragon

Cross posted from niche-canada.org

Our colleagues and friends at NICHE (Network in Canadian History & Environment) and The Otter/La Loutre have just published an interesting article on an Historical GIS project based at the University of Alberta. They have generously offered it for cross-posting here. The project’s partners share many of the same goals as our Geohistory/Géohistoire efforts, and we hope to work with them closely in the future.

Part of the article reads as follows:
“The primary goal of our project is to build understanding of the complex and conflictual histories of Edmonton’s river valley. We are working toward that goal in several ways. One major effort is directed toward the production of a digital atlas highlighting the lesser-known histories of Edmonton’s river valley. Conceived as a work of public history and animated in part through the use of Geographic Information Systems [GIS], the atlas is aimed at a general audience. Over the past few years, project participants have been working to develop a purpose-built platform to display compelling historical evidence (photos, documents, film, maps, etc) within spatially-oriented narratives. The effort has involved computer scientists and digital humanists collaborating with historians to produce software intended to provide a more satisfactory means of framing arguments about the significance of particular spatial and historical processes. Once sufficiently functional, the software will be released in an open source format. In this way, it will position non-experts to deploy advanced GIS tools in the service of community-based research and dissemination.”

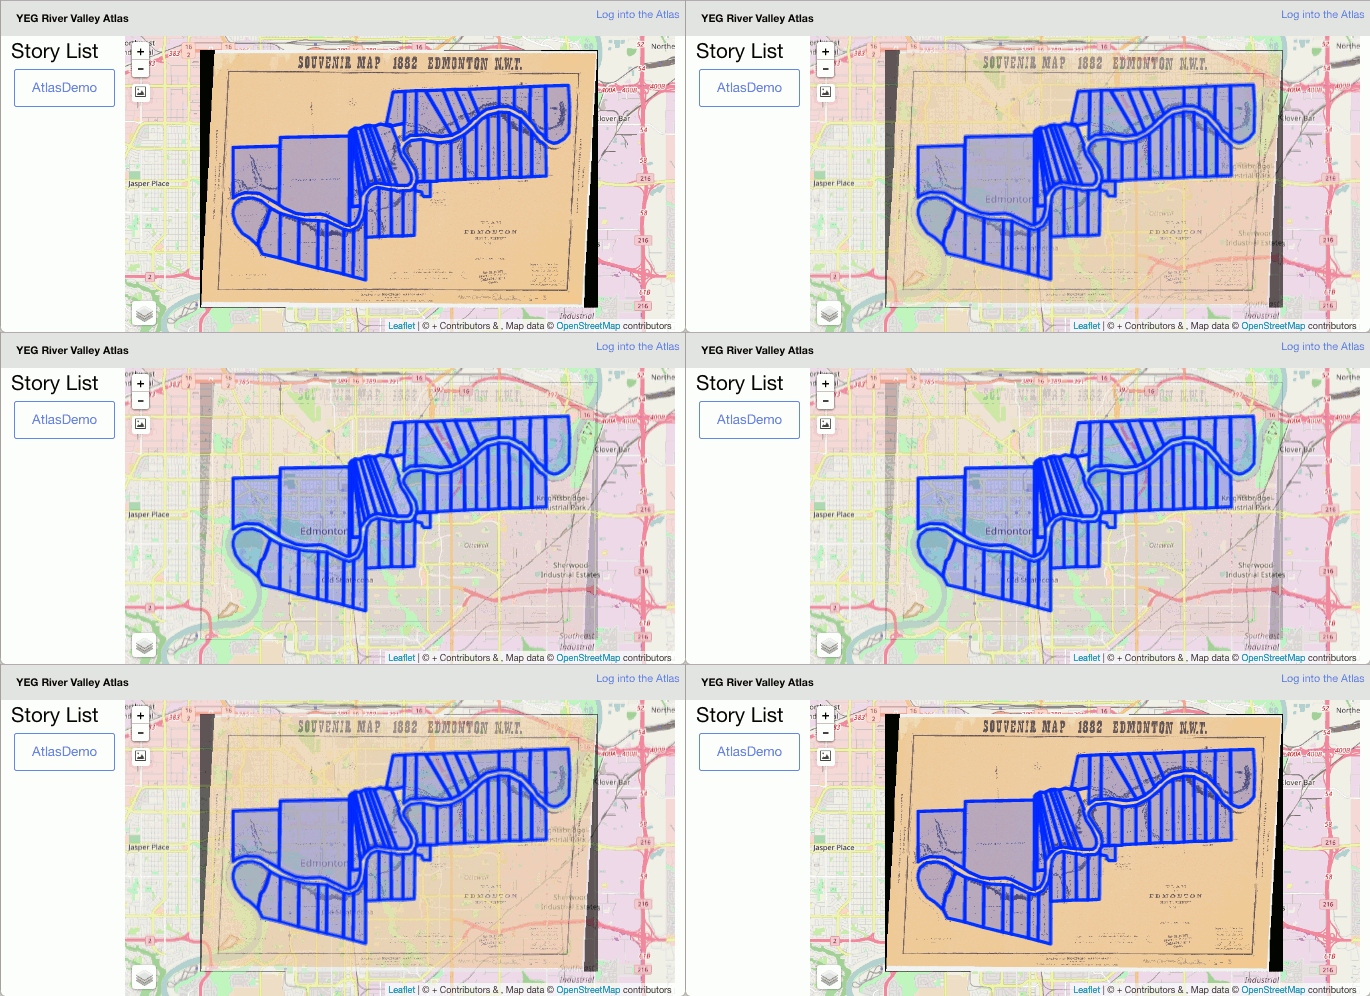
Demonstrating one of the capacities of our digital atlas, this clip integrates an 1882 Map of Edmonton as a tile layer with varying opacity over the current (2017) OpenStreetMap data. The annotated regions highlight 1882 state-sanctioned land ownership and are displayed in juxtaposition to the current land usage. All materials are in the public domain.

You can read the entire article at this link.