Map Your History! Building and Sharing a Historical Spatial Data Infrastructure with the Keweenaw Time Traveler Project

While Historical GIS (HGIS) has become a familiar approach in the social sciences and humanities (Gregory and Geddes, 2014), recent trends in the social science use of GIS have called for HGIS implementations that can apply Big Data-based HGIS approaches to more qualitative research questions and, perhaps most importantly, more closely involve the public. Approaches range from allowing users to contribute to HGIS research using improved web interfaces, such as the New York Public Library’s Building Inspector, to the expansion of qualitative HGIS research (Olson, 2011; Lafreniere and Gilliland, 2015). In the broader world of GIScience, researchers have developed hybrid qualitative/quantitative tool combinations that expand the research potential of GIS further still (Kwan and Ding, 2008; Jung and Ellwood, 2010); these have more recently become topics of interest in the HGIS community as well. As part of this trend, Michigan Technological University’s Historic Environments Spatial Analytics Lab (HESAL) is preparing to launch the Keweenaw Time Traveler project – combining the latest generation of historical spatial data infrastructure with Web 2.0 technology and public outreach in ways that foster closer connections between research and the public by making history both fun and accessible.

Our Subject in a Nutshell: The Copper Country

The Keweenaw Time Traveler Project (KeTT) brings to the public a regional HGIS focusing on the Copper Country of upper Michigan, a region of the Midwest USA that contains the world’s largest deposits of nearly pure elemental, or native, copper. Native Americans exploited this resource for thousands of years; a subsequent industrial copper boom in the mid 19th century led to the area becoming the world’s largest supplier of copper by the 1880s, with a rapidly growing population and massive mining infrastructure quickly built in what had been a remote, if beautiful, wilderness. By the end of WW I, economic factors coupled with the growing cost of extraction led to a long, slow decline in the Copper Country’s mining economy, ending with the closure of the last mines at the end of the 1960s. When mining activity ceased, the entire region became a vast industrial archaeology site, a relict landscape. Today, with the population a fraction of its historical peak, the Copper Country’s economic base has largely shifted to service and tourism; local identity remains closely tied to Keweenaw’s mining heritage, however, and the area attracts visitors as much for its mining history as for its natural beauty.

www.mapyourhistory.org

Building the Foundation of the KeTT: Datasets and the
CC-HSDI

The Keweenaw Time Traveler benefits from the richness of historical data found within its geographic area of focus. The largest historical copper mining companies in the region, such as the Calumet & Hecla and Quincy mining companies, were among the great industrial giants of their day; the scale of their enterprise required a vast industrial infrastructure along with company towns to house their workers, all of which had to be designed, built, and paid for. As a result, most of the towns and large mining locations in the Copper Country are extraordinarily well-documented in the form of an extensive body of Sanborn fire insurance plans (FIPs), company-produced maps with detail that even surpasses FIPs, plan drawings and blueprints. In an age of corporate paternalism and scientific management practices, mining companies also extensively documented the lives of their workers and their families; the KeTT team has begun the digitization of an unprecedented wealth of detailed records on company housing, employee records and health records that provide far more information than standard census data. These are combined with decennial census data from the Minnesota Population Center, business and phone directories, and school records to provide a uniquely detailed look at the history of an entire region down to the level of the individual over the course of a century.

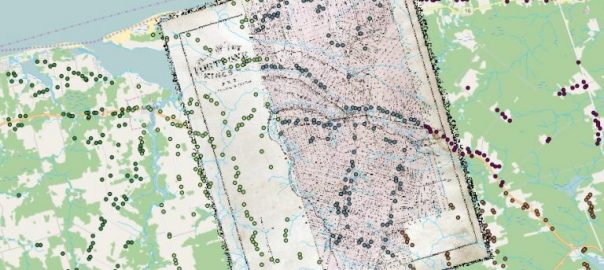
The core of the project is the Copper Country Historical Spatial Data Infrastructure (CC-HSDI), a next-generation implementation of HGIS designed to better facilitate both quantitative and qualitative research, while also fostering public engagement with both local history and the concept of HGIS itself. Using ArcGIS Desktop, ArcGIS Server and a PostgreSQL geospatial database, the CC-HSDI contains a series of ESRI Map Services consisting of georeferenced maps or FIPs broken into a series of time slices roughly equating with census years (in addition to smaller collections of maps from other years). Building these map service presented an early challenge to the KeTT team, as the size of each map service (representing a single town in a single year) ran into the tens of gigabytes and required the establishment of a dedicated PostreSQL geospatial-enabled server at Michigan Tech. Subsequent expansion of the HSDI will require these services to migrate to an off-premises enterprise-scale server facility (Amazon AWS) in the near future.

The historical built environment of each time slice in the CC-HSDI is then hand-digitized from the map services, resulting in over a hundred thousand building footprint polygons (as well as roads, rail lines and a few other infrastructural components). These polygon shapfiles serve as the geographical anchor point for all of the CC-HSDI’s non-map-based historical data mentioned previously and constitutes the “built environment stage” of the HSDI (after Lafreniere and Gilliland, 2015). This stage not only includes the building footprint itself, but other relevant data transcribed from the FIPs including the spatial arrangement,  street address,  and number of stories for each building.

Linked to the built environment stage geodatabases are non-map sources including data from the nearest census, business directories, phone directories, and company and school records. These records capture the social environment of each time slice in incredible detail, including whether a primary school student was immunized, or the medical profile of mining company employees. Coupled with the census data and business directory data that are already staples of HGIS, this “social environment stage” (after Lafreniere and Gilliland, 2015) not only represents a step forward in the ability of HGIS to contribute to qualitative research on past social environments, but provides the public with a wealth of local information that fosters a personal connection with the HGIS.

The KeTT prototype web apps, developed in ArcGIS Online Web AppBuilder, allowed the team to gain valuable experience in developing requirements for the forthcoming full public launch of the KeTT Project.

Public Outreach and Collaboration: The Keweenaw Time Traveler

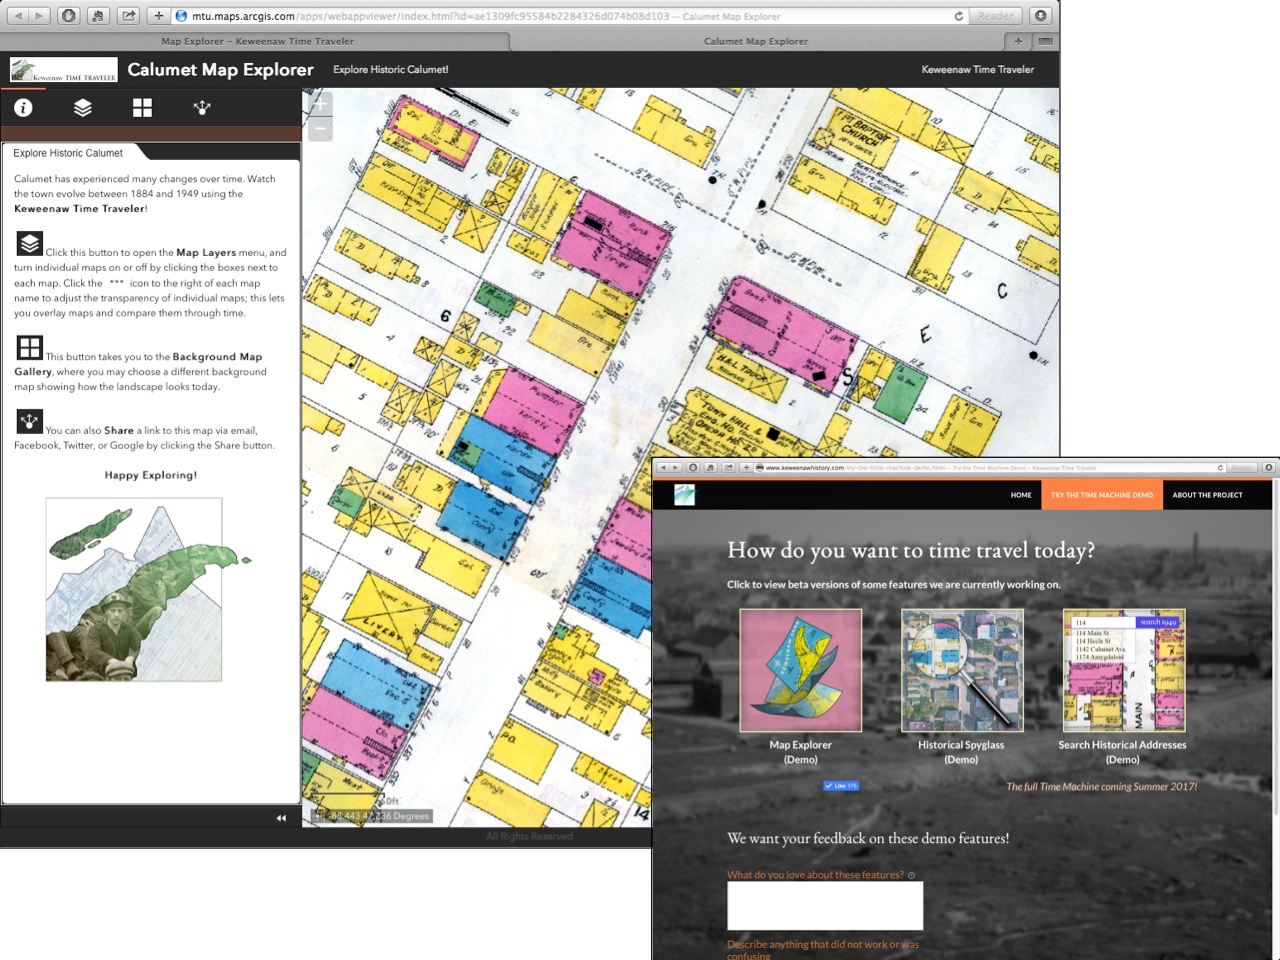
While the Copper Country HSDI is an invaluable research tool in its own right, The KeTT project serves to connect the public with a new way of viewing their past environments.  This is accomplished through the use of web apps. Each app represents a different way of exploring and/or contributing to the HGIS. The KeTT is currently developing four different web apps that allow the public to interact with and contribute to the HSDI. These web apps provide the user with tasks ranging from basic historical map interaction exercises to facilitating more complex storytelling:

  • Recording the built environment by building material (using the fire insurance plan color-codes)
  • Identifying and recording the broad use-type of a structure (dwelling, commercial, institutional etc.)
  • Transcribing descriptive map text for individual buildings
  • Contributing personal stories and recollections about specific places on historic maps

Initially, the team used ArcGIS Online’s Web Appbuilder to build and test these apps for the KeTT. ArcGIS Online apps are an excellent resource for HGIS researchers looking to share data with the public; researchers with little or no programming background can quickly convert GIS data into customizable, publicly accessible web apps that take advantage of ArcGIS Online’s robust back-end infrastructure. However, large raster datasets can become expensive to share this way, as are the implementation of geospatial analysis tools, which consume ESRI credits. After building several prototypes, the KeTT team also realized they wanted more control over the app interfaces and underlying programming logic than the Web AppBuilder provided. This meant hiring a programmer and developing custom web apps in Javascript that made use of the CC-HSDI’s ESRI map and feature services. Despite this, ArcGIS Online’s Web App Builder proved to be invaluable for creating app prototypes and allowing the team to develop a clearer ideas about the look and feel of the final web apps.

GRACE project

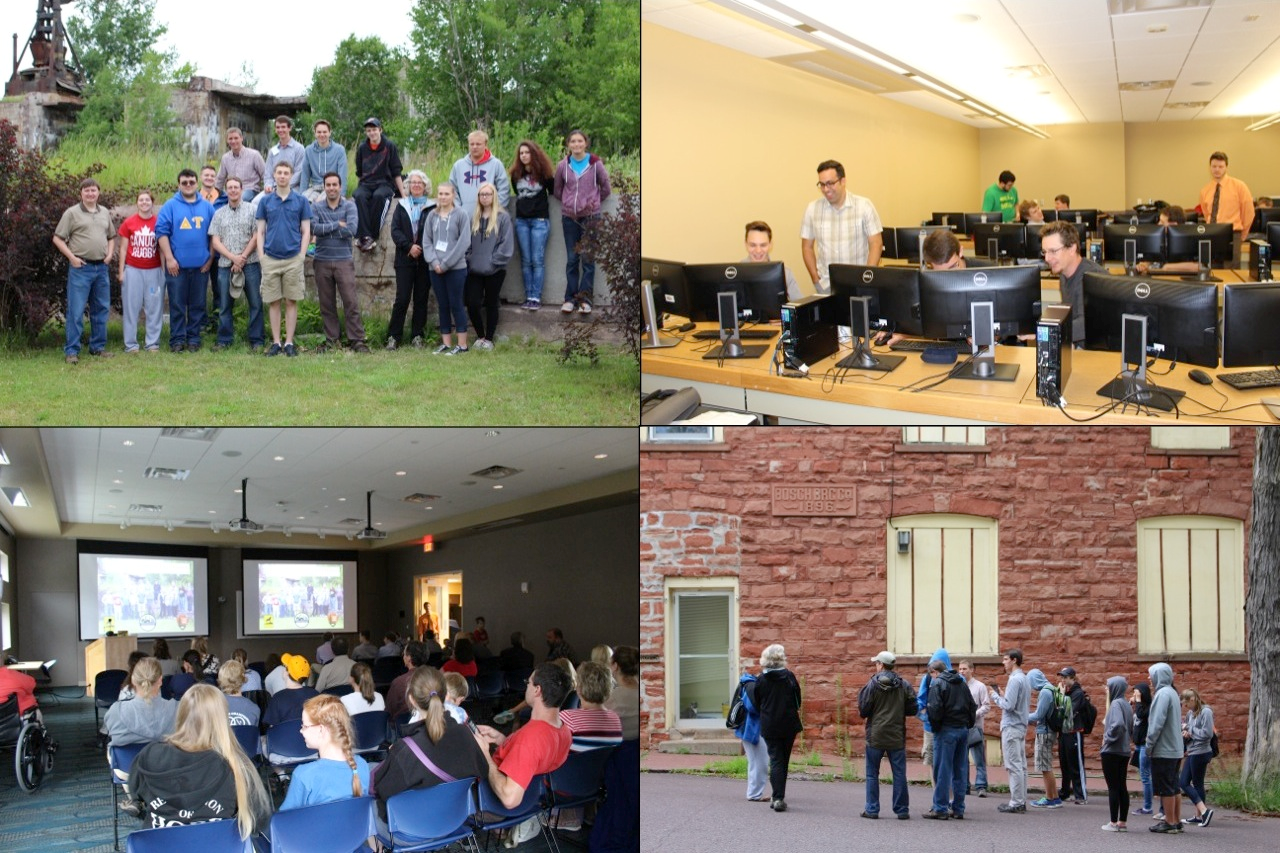
The KeTT project has emphasized public outreach and involvement as an integral part of the construction of the HGIS, not just its dissemination or end use. The team has reached out in several ways to accomplish this. Last summer’s GRACE program served as an early example of what the KeTT project could achieve. The G.R.A.C.E. Project — (GIS Resources and Applications for Career Education project) is a NSF funded collaboration between Dr. Yichun Xie, PhD, Professor/Director at Eastern Michigan University’s Institute of Geospatial Research and Education, Dr. Don Lafreniere at MTU’s HESAL, Michigan’s Virtual University, and several statewide professional GIS organizations to provide hands-on training in the use of GIS to students and teachers in economically disadvantaged communities.  Last summer, the GRACE project partnered with the Keweenaw National Historic Park to bring GRACE to the Copper Country. Interns recruited from local high schools joined the HESAL at MTU in Houghton, Michigan to digitize major portions of the KeTT’s built environment stage from Sanborn fire insurance plans. During the course of the internship, GRACE students not only learned resume-building GIS skills, but also explored the history of their local community at a level of detail few people have access to. At the end of the internship, interns used ArcGIS Online StoryMaps to share portions of their local history they found most interesting during their work with members of the public. The KeTT team found the GRACE project to be a great way to involve the local community in ways that provided real benefit, and to generate some publicity in the process.

The GRACE project took high school students into the lab and field, helping to build the Copper Country HSDI while also using it to explore the historical built environment of their local community and, ultimately, to share their experiences through public presentations.

Next Steps

While a lot has been accomplished thus far, The KeTT project is just warming up; we plan to “go live” this spring, replacing the current beta web apps on the project website with the final, custom-programmed web apps that allow the public to explore, interact with, and contribute to the Keweenaw Time Traveler. The release of the final apps will coincide with a new season of KeTT team outreach activities in partnership with Keweenaw National Historic Park and Keweenaw Heritage Sites to spread awareness of the project and provide public outreach. In addition to the ongoing GRACE project, we will be bringing custom-built touchscreen kiosks to numerous public events around the Keweenaw that allow people to use the KeTT web apps with the help of KeTT team members and partners. Stay tuned at www.mapyourhistory.org!

References

Gregory, I. N., & Geddes, A. (2014). Toward spatial humanities: Historical GIS and spatial history. Bloomington: Indiana University Press.

Jung, J.-K., & Elwood, S. (2010). Extending the Qualitative Capabilities of GIS: Computer-Aided Qualitative GIS. Transactions in GIS, 14, 1, 63-87.

Kwan, M.-P., & Ding, G. (2008). Geo-Narrative: Extending Geographic Information Systems for Narrative Analysis in Qualitative and Mixed-Method Research. The Professional Geographer, 60, 4, 443-465.

Lafreniere, D., & Gilliland, J. (2015). “All the World’s a Stage”: A GIS Framework for Recreating Personal Time-Space from Qualitative and Quantitative Sources. Transactions in GIS, 19, 2, 225-246.

Olson, S., & Thornton, P. A. (2011). Peopling the North American city: Montreal 1840-1900. Montreal: McGill-Queen’s University Press.


Breathing new life into old Historical GIS data

— the benefits of the long-tail of the Ontario Historical County Map Project and the Don Valley Historical Mapping Project data

Most academics who’ve written about Historical GIS have discussed the high-cost of building HGIS projects (Gregory and Ell, 2007). Building any GIS project is an expensive endeavour. Few, however, have mentioned the benefits of the ongoing nature or the extended length of some projects; and the long-term benefits of data projects Ontario Historical County Map Project (OCMP) and the Don Valley Historical Mapping Project (DVHMP) are two projects that have benefitted from the long-tail of their existence in order to continue to develop and enjoy useful applications and use of the long-ago-built (or still being built) historical data.

The OCMP was conceived a few years after the release of the well-known Canadian County Atlas Project at McGill University Libraries in the late 1990s. Nineteenth century County Maps were generally published earlier than the County Atlases. The Atlas project focused solely on the bound maps, and the OCMP focuses only on the earlier large-format maps. Like the Atlas project, however, the main focus of the County Map Project is to allow for the querying of land occupant names found on the maps, and the display of the names on images of the historical maps.

Fortin 2017 3
Canadian Historical County Map Project result of search by Name in Etobicoke Township plate, York County Atlas, 1878

While the McGill project did not use any GIS technology for displaying name information, it did take advantage of the web-technology of its day to graphically lay-out images of the atlasplates, and PHP to link image locations within the database of land-occupant names. The Atlas project was certainly an inspiration to us in developing the Ontario County Map Project.

In contrast to the types of tools used in the Atlas Project, the OHCMP has been a GIS project from the beginning. Like the Atlas Project, however, we also wanted to ensure that users of the County Map project could benefit from web technology to view the maps and GIS data. Being a GIS database, however, a new method of dissemination would need to be used.

Early tests of web technology were pre-Google and used what is now archaic web-mapping software. Our first attempt in 2004 utilized Esri’s ArcIMS (Internet Map Server), made available to us as part of our campus site license with Esri Canada.  We loaded our entire database into ArcIMS as a test, which at the time consisted of only Waterloo and Brant counties. Somewhat surprisingly, we were able to build a sophisticated querying tool and managed to display the georeferenced county map scans in the online map.

Ontario Historical County Map Project rendered in Esri’s ArcIMS software

While yielding relatively impressive results for the time (if one were patient enough to wait for results of a query or a zoom-in or -out) it was clear that this setup was less than ideal as the software was extremely difficult to install, very slow to render results, and gave us difficulties finding adequate server space on which to permanently install the software.
Due to the limitations of available software, developing a web map of the land occupant names of the project was put on hold. Of course Google Maps changed the entire web-mapping landscape in 2005. Despite the adoption of Google Maps by many to display their data on the web, our attempts were hampered by the now large size of our land occupant database. While MySQL was often used to work alongside PHP and the Google API at the time, the conversion of our geospatial database into a MySQL database would have been a step back in the GIS development of the project.

Other more recent attempts at using web-mapping technology in 2013 also included a Mapserver configuration with OpenLayers and a PostgreSQL geospatial-enabled database using PostGIS. While the shapefile data did need to be converted to PostGIS, this setup at least promised the maintenance of our database in a GIS environment, compared to using MySQL. The resulting web-map was very promising, but required quite a bit of coding and manipulation. Having no programmer on the team or any funds to hire one, my programming of the application was limited to a six month research leave and the odd-slow day at the Map and Data Library. Without a programmer, it was clear this solution was less than ideal and would take years to complete.

Openlayers-Mapserver-PostGIS rendition of the Ontario Historical County Map Project

For many years I ignored ArcGIS Online as possibly an overblown idea by Esri. How could one actually build an online tool with GIS functionality and get us to buy into it, I always wondered. However, its popularity grew so much among our U of T users that I eventually needed to learn how to use it to be able to support it. What better way to teach myself how to use ArcGIS Online than to load the County Map Project data, I decided. To my immediate surprise, ArcGIS Online was not only fun and full of great GIS and web-mapping features; it also had the Web AppBuilder application built into it. Along with dozens of Story Map templates, the Web AppBuilder allows you to take your GIS data into a web skin where you can add customizable widgets that work extremely well, even in mobile browsers. Being able to query or filter the 80,000 or so names in our database was a key consideration in adopting any web technology for the project. ArcGIS Online delivered this amazingly well, and also allowed for the rendering of high-resolution images of the scanned County Maps. The ease of use and customization of web apps without the need for coding are also fantastic selling points. Other fun but useful widgets include using animated timelines of “time-enabled” data, and a swipe tool that allows for viewing two datasets on top of the other and sliding a toolbar to switch between displays.

ArcGIS Online version of the Ontario Historical County Map Project with Querying tool display

Adopting ArcGIS Online as a web-mapping tool has allowed the project to be out in the public eye where users can actually take advantage of the data built over the past 15 years. I never thought we would have a web-mapping solution before we finished the database, but as it stands, I am pretty happy with most of the functionality of the web app at this point, as our database continues to grow and we continue to compile more land-occupant names from Historical County Maps. Interestingly, while writing this post I actually received three email messages about the project and requests for further information from users of the County Maps site. Without making our data available in this powerful way, I doubt our project would have drawn so much attention.

Inspired by my success with the web-app builder tool, I decided to also build an app for the DVHMP and found that the data we had built over seven years ago really came to life on the web. Being able to query the data and render both polygon and point data together in one view online is empowering.

ArcGIS online is of course not the only tool that has taken advantage of web-mapping and cloud computing advancements to allow users to build their own web map apps. Products such as Mapbox are also increasing in popularity because of their ease of use, powerful functionality and customizability, and the attractiveness of the final map product.

Web Mapping has been around since the 1990s, but with new advanced web-mapping technology like ArcGIS online and Mapbox, it may be time for many other dormant or long-forgotten HGIS datasets to be pulled out of hard drives, or USB sticks to be given new life displayed in easily created yet powerful web maps. I am excited at the thought of possibly seeing the Montréal Avenir du Passé data for instance, available for display on a web map for all to interact with.

The Canadian HGIS Partnership is investigating many web-mapping tools and visualization methods. We are also working with Esri Canada, as part of the GeoHist project, to provide specific HGIS requirements for online mapping tools. With the powerful components already available in ArcGIS online, Mapbox, and other web mapping tools, the future of web-mapping for HGIS is certainly very exciting and accessible to anyone interested in developing them without the need to code.

References:
Gregory, Ian., and Paul S. Ell. Historical GIS: Technologies, Methodologies, and Scholarship. New York: Cambridge University Press, 2007.

Moldofsky_Sec2M1_freq_for_post_rescale

Update on Historical GIS web-mapping pilot site

Last June at our mid-term conference we presented preliminary results from our research on Geovisualization methods for Historical GIS in Canada. That presentation along with a number of the others presented that day are available on this website, via the program document with embedded links AVAILABLE HERE (Scroll down to Whitepaper update: HGIS Geovisualization (Byron Moldofsky)).  Since that time we have been working on revisions to the paper reviewing that research – and we also decided to change the titling of it from “White paper” to “Working paper” – reflecting the exploratory character of some of the research and the speculative nature of its results. The full “Working paper” is now available AT THIS LINK.

The paper may appear discouragingly long, but please do not be put off – about two thirds of the text is a reproduction of the online questionnaire we administered (Appendix 3: Canadian Historical Web-mapping User Needs Survey) and detailed reporting of some of the results of that survey (Part 4. Results of Canadian Historical Web-mapping User Needs Survey.) Many of you went online to take this survey – so you may be interested in what your peers have had to say, in the aggregate (see chart above, for example), and in selected comments. Thank you again for sharing your experiences and thoughts.

These “Results…” are the main addition to what was presented last June, along with a more developed “Part 5: Next steps: Developing principles of practice and for Canadian HGIS web-mapping activities, and plan to implement these in our Partnership development pilot website.” (pp. 45-48.) In this section we make the following proposals for principles of practice in developing our project’s collaborative web-mapping resources, which I would like to highlight here:

(Proposed) Principles of practice for Canadian HGIS Partnership web-mapping activities

  1. Support long-term sustainability and sharing of data and mapping
  2. Support of visualization for both presentation purposes and data exploration and analysis
  3. Support transparency of the web-mapping process, through good meta-data and documentation
  4. Support of multiple platforms, both technical (OS, browsers) and mapping (including proprietary and FOSS4G technologies)
  5. Working collaboratively to avoid duplication of effort and competition among current collaborators and potential partners

These principles are my interpretation of the responses to the User Needs Survey, and the discussion among the project members at meetings including the mid-term meeting last June. I would very much like to gather reaction from potential users and collaborators – so you are invited to respond by email or in the Comments section below this post.

Principles, however, are not of much use without a plan to implement them. The working paper proposes a three-pronged approach to supporting project HGIS web-mapping goals:

(Proposed) CHGIS Partnership development web-mapping pilot website activities

  1. Analytical evaluation framework: A set of questions to consider and evaluate in deciding on historical webmapping approach and technology
  2. Historical web-mapping technology profiles: Standardized descriptive comparison of technologies, incorporating “reviews”
  3. Comparative examples of web-mapping approaches: Examples of historical web-mapping projects using the same data and citing the same goals but using contrasting technologies

These three approaches are laid out in some detail in the concluding section of the working paper (Part 5, pp. 45-48), with tangible results proposed for each. If you have time, please take a look at this final section which outlines these pilot project activities, and suggests sample data sets, and let me know if you have any concerns or suggestions, either in the Comments section below, on the email listserv discussion thread or by personal email.

As we all know, such activities can consume large amounts of time and resources. We have reached consensus that the priority on the web-mapping side should be 3. Comparative examples of web-mapping approaches, while not completely neglecting the other two activities. Over the remaining months of the project we will work to create sample projects online for several of the data sets suggested within the paper. We have already started on these, and enlisted some of our partners and collaborators for data and technical assistance. We will try to provide one or two progress reports via these News and Notes posts, as soon as we have some neat web-mapping to show you!

Detail of a georeferenced historical map and the combined digitized house locations from the 1880 Historical Atlas of PEI. Each student digitized a different township, symbolized here by the different colours.

Teaching Historical GIS and Restoring Lost Communities in the Classroom

This article is a cross-post from The Otter ~ la loutre, and is part of a series on using historical Geographic Information Systems (GIS) for teaching and research in environmental history and historical geography. It is part of a collaboration between the Network in Canadian History and Environment (NiCHE) and the Canadian Historical GIS Partnership Development project. Other articles in the series are available here. If you would like to contribute a post to the series please contact the editors Josh MacFadyen or Jennifer Bonnell.

Canadians have been hitting above their weight in the area of geospatial analysis since the development of the Canada Land Inventory and the world’s first Geographic Information System (GIS) in the 1960s and 1970s. Similarly, environmental historians and historical geographers have made great gains in Historical Geographic Information Systems (HGIS) research over the last decade, including several NiCHE projects, a 2014 edited collection, and now the Canadian HGIS Partnership. Canada is big. And in typical high modernist fashion, postwar scientists trying to fathom it ignored the knowledge of the rural, northern, and indigenous people who understood its land and water. Instead scientists turned to digital tools like GIS to examine and measure the nation. In what we believe is a post-normal and integrative approach, environmental historians are now both using the software and critiquing the normative processes it helped to create. But Canada is still big; its libraries, students, and other knowledge resources are very far afield. Our communities of digital scholars employ digital tools to collaborate and communicate our results across the continent. This post focuses on the students using these tools and the new ways historians are teaching HGIS online. This kicks off a series written by NiCHE and CHGIS collaborators on geospatial tools and analysis for Canadian historians.

Click here to go to complete article on Niche site…

Highlights of mid-term conference June 20, 2016

On June 20 we hosted the project’s mid-term Conference, at about the half-way point of our 2-year mandate. Interested folks from around the country were invited to attend in person at the University of Toronto, or tune in online to our video webcast. The conference program, with embedded links to many of the speakers’ presentations, can be found here.

Project collaborators reported on progress made to date on the planned white papers, and on how we have been advancing the project’s goals. More about the white papers will be posted in the future, as completed versions are released or excerpts published. Several of the related slide presentations are online, however, again linked through the conference program. Feedback to the authors via email is invited.

We also invited speakers from other related GIS and webmapping initiatives to bring their own unique perspectives to the group. For those of you who could not be there, here are a few of the highlights:

Amber Leahey (Scholar’s Geoportal): Amber gave us some of the background on the Scholar’s Geoportal, a GIS data portal/discovery engine run by the Ontario Consortium of University Libraries, and housed at the University of Toronto Library. Their experience with storing and linking to large GIS data sets, and the process of improving the discovery, extraction and data preview aspects of this site can provide our project with significant help in organizing and designing our own pilot Historical GIS data portal over the coming year.  Amber’s presentation slides may be viewed at this link.

Iain Greensmith and Jonathan Van Dusen (Esri Canada): Esri has been an enthusiastic partner and collaborator in this project, and Iain outlined some of the capabilities of their GIS data portal “sandbox” installation that has been set up for experimentation by collaborators. He once again asserted the capabilities of Esri’s portal options to link to data stored remotely, as well as in Esri Online, and make these available to those with or without an Esri license, under certain configurations. He highlighted the customizability of the portal’s front end, and touched on the geovisualization possibilities of their software. These were explored in more detail in an afternoon session by Jonathan, who reviewed Arcgis Online and Story Maps strengths and options for customized web-mapping. Iain’s presentation slides are linked here; Jonathan’s slides are found at this link.

Caitlin Blundell (Geoalliance Canada): Caitlin is the director of communications at GeoAlliance Canada. GeoAlliance is built on the foundation of the Canadian Geomatics Community Round Table, and its mandate is to raise the profile and efficacy of the Geomatics sector in Canada in 3 main areas: Sector Identity, Education and Data Access. When asked in the Question Period how Historical GIS could fit into their framework, Caitlin responded with her own question: “Do you think the Historical GIS community would benefit from a national population that had a greater awareness of the value of GIS and  geomatics and geography in general?” (audience murmured general agreement…) “If you walked into a historical conference and said ‘I do historical GIS’, and people said oh I know what that is, GIS is neat and really helpful…’ Does that happen now?” GeoAlliance has a “rising tide lifts all boats” type of approach, and are welcoming to all GIS sectors, but we will have to figure out how to work with them to everyone’s advantage. Caitlin’s slide presentation is found at this link.

In the afternoon we enjoyed a number of presentations related to HGIS research and teaching. Robert Sweeny outlined his White Paper giving an historical perspective on the evolution of HGIS in Canada, with particular reference to urban HGIS projects like “Montréal l’Avenir du Passé”. Geoffrey Cunfer then outlined what he characterized as “an alternative history of Historical GIS in Canada… another path through environmental history…”, more focused on rural environmental HGIS projects. Interesting contrasts indeed! Following that, Marc St.-Hilaire, Josh MacFadyen, and Don Lafreniere with Dan Trepal spoke about their research and teaching experiences over the last few years. Again, several of these are accessible as slide presentations (and Robert’s as a paper, to which he invites comments) linked through the conference program.

Subsequently the session on Historical Geovisualization featured a couple of guest speakers, as well as some drama.

We had scheduled Jonathan Marino, from Mapstory.org as a key speaker in this session, since Mapstory.org is a fascinating example of a geovisualization “storytelling” project that appeared well funded and utilized open source mapping tools, and had gained a lot of traction in the U.S. a year ago. In spite of this, the project decided to do a complete re-design of their user interface. This caused an interruption in service of almost a year, and they are just getting re-launched now. If that wasn’t dramatic enough, Jonathan emailed us the day before our conference, and explained that he had just returned from Africa the previous day, and appeared to have a virulent strain of the flu – or perhaps malaria. In any case, he was in no shape to travel. We were very disappointed, and wondered if he might be open to presenting remotely. With some help from the U of T Media Tech staff, in the few minutes before his time slot, we managed to get him online with slides and sound working fine – and so he presented from Washington, D.C. Despite a hacking cough, Jonathan gave us an interesting outline sketch of Mapstory’s genesis as “The atlas of change that everyone can edit”, a place to communally store and share geographical data, and build narratives. It appears that the main reason for their re-boot was the need for more sophisticated group editing tools – the need for Wikipedia-style capability to track changes and curate the data in “consensus” data layers. Jonathan was able to go into some of the details behind this transformation, technical and political, and answer some of our questions. Jonathan’s slide presentation can be accessed here.

A different approach to geovisualization online, also unique, is the Neptis Geoweb. (www.neptisgeoweb.org/) The Neptis Foundation (www.neptis.org) is one of our project partners, and Marcy Burchfield, the executive director, reviewed the evolution of this webmapping platform, which was designed to examine urban growth at the regional scale, primarily working in the Greater Toronto Region to day. A sophisticated interface, the Neptis Geoweb does offer customized depictions of regional planning issues (including historical urban development) but is also interested in the integration of VGI or “volunteered geographic information”. They have tried to do this by allowing people to create their own “User stories” – but, similarly to Mapstory, it is here they have run into some challenges. We hope to utilize the experience of Neptis personnel in working through our project’s design of our pilot webmapping site.

The day concluded with reactions from some participants, and then a discussion of “Where we go from here?”. A wide-ranging conversation about the strengths and weaknesses of HGIS in Canada seemed to crystallize a few important principles for the project:

  • Making HGIS data available, including national historical base data, should be the priority for the project, to be as open-access as possible, to the academic and non-academic community
  • The data does not need to be in a central repository, but metadata and discoverability need to be robust and prioritized in the portal design
  • We need institutional partners to support these efforts, rather than ephemeral grant-based support, and libraries and others with the mandate to preserve data are natural allies

These ideas were followed-up in the project business meeting the next day, and the collaborators as a group are determined to make sure we take these ideas through to a successful conclusion. We will keep you all informed and continue to get your input as we pursue these goals over the next year!

Preview of mid-term conference June 20, 2016

The Canadian Historical GIS Partnership Development mid-term conference coming up this June 20 looks like it will be a landmark day. We have invited a number of folks – some collaborators and some from outside our group – to talk about their own projects, and how these relate to historical GIS data and mapping in Canada. Just as a few examples – Marcy Burchfield from the Neptis foundation (neptis.org) is coming to speak about how their research into urban growth and planning in cities across Canada benefits from incorporating historical land use and development data, and their experience with engaging the public with online mapping. Geoffrey Cunfer is the director of the University of Saskatchewan Historical GIS Laboratory (www.hgis.usask.ca) and will give us some insight into how this successful facility contributes to environmental historical research on the North American plains, as well many other historical GIS-based international studies. Caitlin Blundell is Communications Director for GeoAlliance Canada (geoalliance.ca) and will share what happened at their “Map to the Future” meeting in Calgary last March and discuss how GeoAlliance Canada will support the geomatics and geospatial community in the coming years. What is the place for historical GIS in this broader geo community initiative? And Jonathan Marino is coming from Mapstory.org, to talk about how their project has created “The atlas of change that everyone can edit” – and some of the achievements and challenges along that path.

We also expect to have participants, in-house or online, from Statistics Canada, SSHRC, libraries and universities across the country, and (we hope) lots of non-professional history buffs. If you can make it to Toronto, please register and join us in person at the corner of St. George and Bloor (see Conference Program for the address.) And if not, please join us online – login details to come later.

Byron Moldofsky
Project Manager
Canadian Historical GIS Partnership Development Project

Signal Boost: The Value of Cross-Sector Partnerships

Over the past several decades, organizations across Canada have worked independently to promote geospatial literacy and the value of geospatial data, tools and technologies. They’ve targeted different audiences (including school children, decision makers in government and industry, the general public, and academe), with varying degrees of success. Many have reported that the impact of these communications was limited by a lack of popular awareness of the value of geo. Wouldn’t it be easier to communicate the value of historical GIS if you were confident your target audience actually knew what GIS was to begin with?

GeoAlliance Canada is working to unite the diverse groups and organizations that make up the Canadian geo community under one umbrella, to work together to create an easily understood, consistent message communicating the economic, environmental and social value of geo. By pooling our energy and resources to create a consistent baseline message, each of our independent signals can be louder and achieve more.

Many of the challenges facing the CHGIS partnership echo the discussions we’ve been hearing across the country. Communicating the value of geo to citizens, fostering collaboration across sectors and disciplines, avoiding unnecessary duplication of efforts and ensuring that all users can access high quality data are commonly recurring themes within our national community.

In the face of these challenges, the CHGIS partnership has seen great success in building partnerships and working across organizations and silos. So what can GeoAlliance Canada do to support the second half of your project? How could you benefit from access to a cross-disciplinary national network? How can we boost your signal to help you achieve your goals? And, if historical GIS should be a part of our national sector identity, what are the key messages you wish to deliver to your peers and colleagues in the community?

GeoAlliance Canada is a neutral platform for the Canadian geomatics, geography and geospatial community to work together on the issues that affect us all. We are pleased to have support from the academic community for our ongoing efforts around data access, education, and sector identity through the Royal Canadian Geographical Society – Canadian Geographic Education and Canadian Association of Geographers Geographic Education Study Group. We’re looking forward to connecting with the CHGIS community on June 20 in Toronto!

Caitlin Blundell,
GeoAlliance Canada

How do we find and link all this geohist information?

The volume of geohistorical data available on the web and stored in various databases is expanding rapidly as the geospatial turn gains momentum and as online mapping tools become more accessible. Historical maps can be situated with a bounding box or georeferenced with precision. Aerial photographs are assembled and georeferenced to analyse a region or to easily locate a specific sheet. Animated or static maps are increasingly being used to visualise phenomenons which affected history at various scales : local (Don Valley Historical Mapping Project), regional (Map of how the Black Death devastated medieval Britain), national (American Panorama. An Atlas of United States History), continental (Mapping the Republic of Letters), trans-Atlantic (The Trans-Atlantic Slave Trade Database) or global (Time-Lapse Map of Every Nuclear Explosion, 1945-1998).

Faced with massive amounts of data, researchers are not just looking for the proverbial needle in the haystack. They need to search for many needles spread across many haystacks. Several initiatives have been undertaken, including by this group, to develop solutions which would improve accessibility to geohistorical data. Portals are generally viewed as a solution to bring together data which pertains to a given location or to the research interests of a group or an institution. Consciously or not, they are designed to showcase the work of a group or institution. We will still need portals as infrastructures to host and distribute geospatial data. But on their own, they will not resolve issues of discoverability, openness and interoperability.

Depending on how effective the developers are at search engine optimisation, a given portal will be more or less easy to find on the web. The user will generally land on the portal’s home page and will then use the system’s own search tools to identify the specific item or items related to her or his research. Some systems, such as GeoIndex+, combine faceted search with a spatial view to facilitate discovery. Others still rely on older catalogue inspired search engines.

Whether or not the desired data can be located, it may not be available for download. Apart from commercial licensing issues, many researchers are still reticent to make their data available for download, but this would be an issue for a separate post. Governments are gradually making data freely available, but there is still a chance that a researcher could end up digitising and georeferencing data which already exists in that form. At this point, the use of a file format incompatible with a researcher’s preferred software becomes a minor inconvenience.

Even when portal developers have the best intentions to make data available and downloadable, the lack of system interoperability makes cross-portal searches a difficult challenge to overcome unless they open API’s or make data available in a linked and open format. While API’s could resolve immediate issues, they would not solve the problems related to security, system maintenance and overhauls. I will therefore emphasise linked and open data as the most promising long term solution to the problem.

Linked data “is a method of publishing structured data so that it can be interlinked and become more useful through semantic queries. It builds upon standard Web technologies such as HTTP, RDF and URIs, but rather than using them to serve web pages for human readers, it extends them to share information in a way that can be read automatically by computers. This enables data from different sources to be connected and queried.” (Source). A World Wide Web Consortium (W3C) standard, it forms the basis for the semantic web as defined by Tim Berners-Lee.

LOD relies upon the Resource Description Framework (RDF) which uses a subject – predicate – object grammar to make statements about resources. These triples, which could also be seen as entity – attribute – value structures (document X -> is a -> map), are machine-readable and use Uniform Resource Identifiers (URIs) to connect different elements together. LOD is already used to make information available and connected in projects such as DBpedia.

The data structures presented as rdf statements are defined by ontologies. The Spatial Data on the Web Working Group  has been formed by the W3C to

  • to determine how spatial information can best be integrated with other data on the Web;
  • to determine how machines and people can discover that different facts in different datasets relate to the same place, especially when ‘place’ is expressed in different ways and at different levels of granularity;
  • to identify and assess existing methods and tools and then create a set of best practices for their use;
    where desirable, to complete the standardization of informal technologies already in widespread use.
    [SDWWG Mission Statement]

Such an initiative will provide us with the tools and the infrastructure to make geohistorical data discoverable and accessible.

Unfortunately, LOD is not a simple solution to implement. Competing ontologies could emerge, which would limit interoperability unless bridges are made to define equivalences. Some institutions’ insistence on defining their own URIs, for place names for example, without connecting them to other authority lists can recreate the silos that we are trying to avoid. Many stakeholders need to open and offer their research data as rdf triples for the web of geohistorical data to emerge, as is already the case with DBpedia, Geonames, and the World Factbook. Designed as infrastructure, LOD tools are still in development and they  do not have much of a “wow” factor which would bring visibility and investment. A pilot project with a strong front end will be required for people to understand what LOD can do so that they will invest the resources required to publish geohistorical data as rdf triples.

There are still issues to be resolved, such as a standard ontology or a set of compatible ontologies. The SDWWG proposes compatibility with upper ontologies, as opposed to dependence upon a given world view of linked data [SDWWG Best Practices Statement]. We must also expect that different teams will publish their data at different levels of granularity. Some will at least provide metadata to indicate that a dataset has social and economic information about Montreal in 1825 while another could publish each data element at the household level. With regards to a scholar’s career, how can this type of publication be recognised for hiring, tenure and grants? The Collaborative for Historical Information and Analysis  has studied data repository practices which can be useful as we move towards LOD. Finally, how will we flag data which is less than recommended for scholarly research? We will need to define peer-review for an LOD world.

There are obviously more questions than answers at the moment, linked and open data provides a long term solution to discoverability and accessibility. Such a solution should be part of future portal designs.

To go further, the SDWWG lists a few publications and presentations. Catherine Dolbear and Glen Hart’s Linked Data: A Geographic Perspective (CRC Press, 2013) can also provide further guidance to the use of linked data from a geographic perspective. Any search for linked data or the semantic web will provide many useful results for additional reading. For historians, Philippe Michon’s M.A. thesis, « Vers une nouvelle architecture de l’information historique : L’impact du Web sémantique sur l’organisation du Répertoire du patrimoine culturel du Québec », is highly recommended.

Léon Robichaud
Professeur agrégé
Département d’histoire
Université de Sherbrooke

Accessing digital historical census boundaries just got a whole lot easier!

Finding and mapping historical census data can be a little difficult. Statistics Canada makes census data available for the 2011, 2006, 2001, and 1996 Censuses, with some profile tables available back to 1991. For boundary files, fewer censuses are made available online, with only 2011, 2006, and 2001 files. They do not provide access to earlier censuses any longer.

There are some sources for earlier census data and boundary files available through the Data Liberation Initiative (DLI) program, a national consortium made up of universities that formed together in the mid-1990’s to pay for and access Statistics Canada data, namely Public-Use Microdata Files (PUMFs). Part of the DLI includes access to older census tables and boundary files, including census tracts, dissemination/enumeration areas, census metropolitan areas, census divisions and census subdivisions, with some boundary coverages back to 1971. These boundary files represent some of the oldest digital boundary files produced in Canada, and are still used by researchers today. Both English and French data files were produced, and files are stored in varying GIS and non-GIS formats.

Today, access to the collection is typically mediated by the library at subscribing DLI institutions, some providing links to the data files online, but most only have access via a local connection FTP server. Given that the data are not available online publically, this prevents people from searching Google and finding the census boundary files. In addition, for some of the censuses, the spatial data are stored in ASCII text, or ESRI proprietary interchange format E00. This presents challenges for use in current GIS, and loading in open geoportals.

In Ontario, Scholars Portal and the Ontario Council of University Libraries (OCUL), have begun a year-long project to gather and convert all existing Canadian digital census boundary files, including the DLI collection, and other census boundaries digitized over the years by university libraries across Canada. The project will make data and documentation available openly in an interactive geoportal – Scholars GeoPortal (http://geo.scholarsportal.info). Access to this important historical GIS collection will be improved greatly, and it is hoped that by making the collection available publically, these data will be shared and reused more effectively, reducing duplication for researchers everywhere.

Here is an overview of the censuses we are almost finished converting and loading, including creating ISO 19115 – North American Profile metadata for. (Some of these were reused from other national projects including the Canadian Century Research Infrastructure (CCRI) GIS boundary files):

2011 – Statistics Canada (in portal)
2006 – Statistics Canada (in portal)
2001 – Statistics Canada, DLI (in portal)
1996 – Statistics Canada, DLI (in portal)
1991 – Statistics Canada, DLI (in processing)
1986 – Statistics Canada, DLI (in processing)
1981 – Statistics Canada, DLI & Map and Data Library, University of Toronto Libraries  (Census Tracts in portal; the rest in processing)
1976 – Statistics Canada, DLI *(only point files available)
1971 – Statistics Canada, DLI & Map and Data Library, University of Toronto Libraries (Census Tracts in portal; the rest in processing)
1961 – Historical Atlas of Canada (Provided by the GIS & Cartography Office, Department of Geography and Planning, University of Toronto) (in processing)
1951 – University of British Columbia Libraries, and CCRI (University of Alberta Libraries) (CCRI in portal)
1941 – CCRI (University of Alberta Libraries) (in portal)
1931 – CCRI (University of Alberta Libraries) (in portal)
1921 – CCRI (University of Alberta Libraries) (in portal)
1911 – CCRI (University of Alberta Libraries) (in portal)

To check out the progress, you can easily view the boundaries by going directly to the portal.

In the near future, we plan to make the census boundaries inventory available so that gaps can be collaboratively addressed by the community and those who are interested in doing national, comprehensive digitizing and georeferencing work for this important historical census collection.

For questions and more information, please contact me at amber.leahey@utoronto.ca

————————————

I would like to acknowledge the ongoing efforts of university libraries for their ability to manage and archive census data, boundary maps, and GIS. These collections are truly valuable to researchers and historians, and access to these collections would not be possible today if it weren’t for these efforts. I would like to thank the kind contributions from the following universities, organizations, and individuals throughout the project:

Vince Gray, Western University Libraries
Eva Dodsworth, University of Waterloo Libraries
Marcel Fortin, University of Toronto Libraries
Leanne Trimble, University of Toronto Libraries
and
University of Alberta Libraries
University of British Columbia Libraries
Data Liberation Initiative, Statistics Canada

And, to Jeff Allen, our student assistant at University of Toronto Libraries & Scholars Portal, who has worked tirelessly on this project for almost a year now…

Many thanks,

Amber Leahey
Data and Geospatial Librarian
Scholars Portal, Ontario Council of University Libraries
amber.leahey@utoronto.ca

On Partnerships

Historical GIS (HGIS) is a challenging and demanding discipline. At the best of times, selecting, scanning, geo-referencing, digitizing and vectorizing the right historical material for a project is a long and arduous investment in both time and money. Because of this investment, researchers are motivated to find pre-built and available data suitable for their projects.

As digital scholarship in the humanities and social sciences evolves, it’s clear that finding others who have done the work of digitizing what you want to digitize, or have scanned what you want scanned, is becoming a necessary part of the academic process. Connecting with other scholars doing what you do is probably more important than ever in an age where digitizing material is only one part of a digital project.

Avoiding duplication is extremely important in many respects. Securing public dollars for undertaking digital scholarship is never guaranteed, and these are getting scarce, so ensuring we are efficient in academia by not duplicating effort is a definite necessity.

Connecting with other scholars and forming partnerships are now necessary to most digital scholarship. This was confirmed to me again recently in the presentations and discussions of the two full-day meetings I participated in this past week with historians, geographers and librarians.

At the Jackman Humanities Institute’s Digital Mapping Workshop, “Mapping Sense, Space, and Time” (https://www.humanities.utoronto.ca/event_details/id=2144) on April 28th, in a session called Collaboration Across Boundaries, presentations by Caroline Bruzelius of Duke University and Natalie Rothman at University of Toronto at Scarborough reminded me of why our group applied to SSHRC to put this Historical GIS partnership together.

In her presentation called “Visualizing Venice: The Life and Times of a Digital Collaboration”, Bruzelius listed seven things digital scholarship requires to move forward. A few of the points she made especially resonated with me.

In her first point she argued that scholars need to be trained in a variety of digital tools. While this practically ensures that scholars do not become experts in most of these technologies, it does, however, lead to better scholarship through asking different questions and thinking differently as a result of varied inquiry.

I think it’s important, as we move forward with our partnership, to remember that GIS is only one tool historians and geographers use in telling historical and spatial stories. GIS needs to be combined with other tools to fully understand the subject at hand and to disseminate our analysis and discourse.

Bruzelius also discussed the importance of open and shared databases of what work has been done. Again, this is something we in the Canadian HGIS partnership felt was one of the most important parts of developing a community of HGIS users and practitioners in Canada. By identifying and helping with the discovery of historical spatial data, we are hoping to prevent duplication and help concentrate efforts efficiently.

Professor Rothman echoed the need for open and shared databases in her discussion on the building of the Serai web site in her presentation called “Building the Serai Collaboratory”. Serai is a free and open online collaborative working platform for scholarship on encounters across ethnolinguistic and religious divides in the pre-modern era (before 16th century.) Serai aims to be a one-stop aggregation for cross-border interaction in the pre-modern world.

Another important point Professor Bruzelius made in her discussion was that Humanists need to tell the public better what it is they do and that they should do this by not only publishing in scholarly journals, but by also making their work accessible to the larger public.

In our partnership, it has been clear from the start that we need input from the public. Historical mapping and GIS is no longer the purview of just academics. Demand from the public for historical maps and digital data was made clear to me during the development of the Don Valley Historical Mapping Project (http://maps.library.utoronto.ca/dvhmp) and the Ontario Historical County Maps Project (http://maps.library.utoronto.ca/hgis/countymaps). With the release of both projects we saw a large demand for more information and access to maps and data generated through the project. Not a week goes by without someone asking me for higher resolution images of the Ontario Historical County Maps!

Because of this public desire for access to historical mapping sources and data, we have in our initial Partnership public participation through The Toronto Green Group, the Neptis Foundation, ESRI Canada, and several academic libraries. Several other public organizations, we hope, will be joining us as the Partnership develops.

From a practical point of view, SSHRC has also made it clear that partnerships with the public are important when applying for grants. We shouldn’t take this requirement as a burden, but instead as an opportunity for community groups and individuals to help us develop better projects through their experiences and by learning from their digital information and data demands.

One of the points Nathalie Rothman also made about the Serai collaborations, struck a chord with me as well. Professor Rothman argued that it is difficult to sustain digital projects such as the ones being presented during the JHI workshop for the long-term without the involvement of librarians. This point was also reinforced in another presentation at this event by Professor Steven Bednarski from the University of Waterloo who relies on the work of librarian Zack MacDonald for the digital mapping of his work on climate and landscape change in medieval England.

I think this is where our Partnership has benefitted from a good start. Not only is our group made up of a humanists and social scientists, it is also loaded with a dedicated bunch of librarians from across the country. Academic Map and GIS Librarians, and now also Digital Humanities Librarians as well, tend to be specialists. Not only can they support digital projects through long-term preservation, but they can also, in many cases, contribute to the scholarly undertaking of many projects.

Earlier this April, At the annual meetings of the Ontario Council of University Libraries’ (OCUL) Geo group, I was also reminded of why our group undertook this Partnership Development Project. In this forum, where all GIS and Map librarians from universities meet to discuss common issues across the province, I was struck by the similarity of the discussions we were having to those in the partnership group. Not only do we also struggle with the demands of digital scholarship and project development, but we also struggle with our approaches to making our work visible to the public.

In 2015, the Geo group applied and received funding from OCUL directors to scan and geo-reference 1:25,000 and 1:63,360 federal historical topographic maps of Ontario held in our collections. The project is winding down as most maps have now been processed through work at McMaster University, Ryerson University, the University of Waterloo, Western University, and Carleton University. The interesting part of the discussion during the day surrounding this project was that the group felt it may be a good idea to partner with other organizations in order to develop a data dissemination tool. A tool that would make the data available to not only OCUL schools, but to the rest of the world, especially in light of public demand for historical maps and data.

As well, the group discussed at length the issue of the growing interest in the topic of Research Data Management for spatial data created at Universities. One of the points that was made was that it is difficult to make data, once ingested in data curation systems, discoverable and accessible to the rest of the world. It is a growing concern as all institutions will most likely be building their own repositories using a variety of technologies as demand grows. In building these repositories, will discovery and interoperability be required? We are not sure. If discovery is not at the forefront of requirements in building these repositories, much of the work by researchers and librarians to build datasets could potentially be lost without systems that branch out over a variety of institutions and locations to allow for interaction between search tools.

Part of the reason for our Partnership is to investigate building discovery tools that do speak to one another and that will avoid duplication. ESRI Canada has partnered with us and we are hopeful that, following the two years of this grant, we will be in a position to recommend how we can build data discovery tools that connect to each other for maximum visibility and that will ensure data sustainability and re-use.

It’s reassuring to know that the academic and librarian communities are both having similar discussions on the topics of partnerships and data discovery. It’s also reassuring that the purpose and needs we had identified in building this Canadian HGIS partnership last year, are the same these two communities are expressing.